Open Access
Fig. A.1.
Download original image
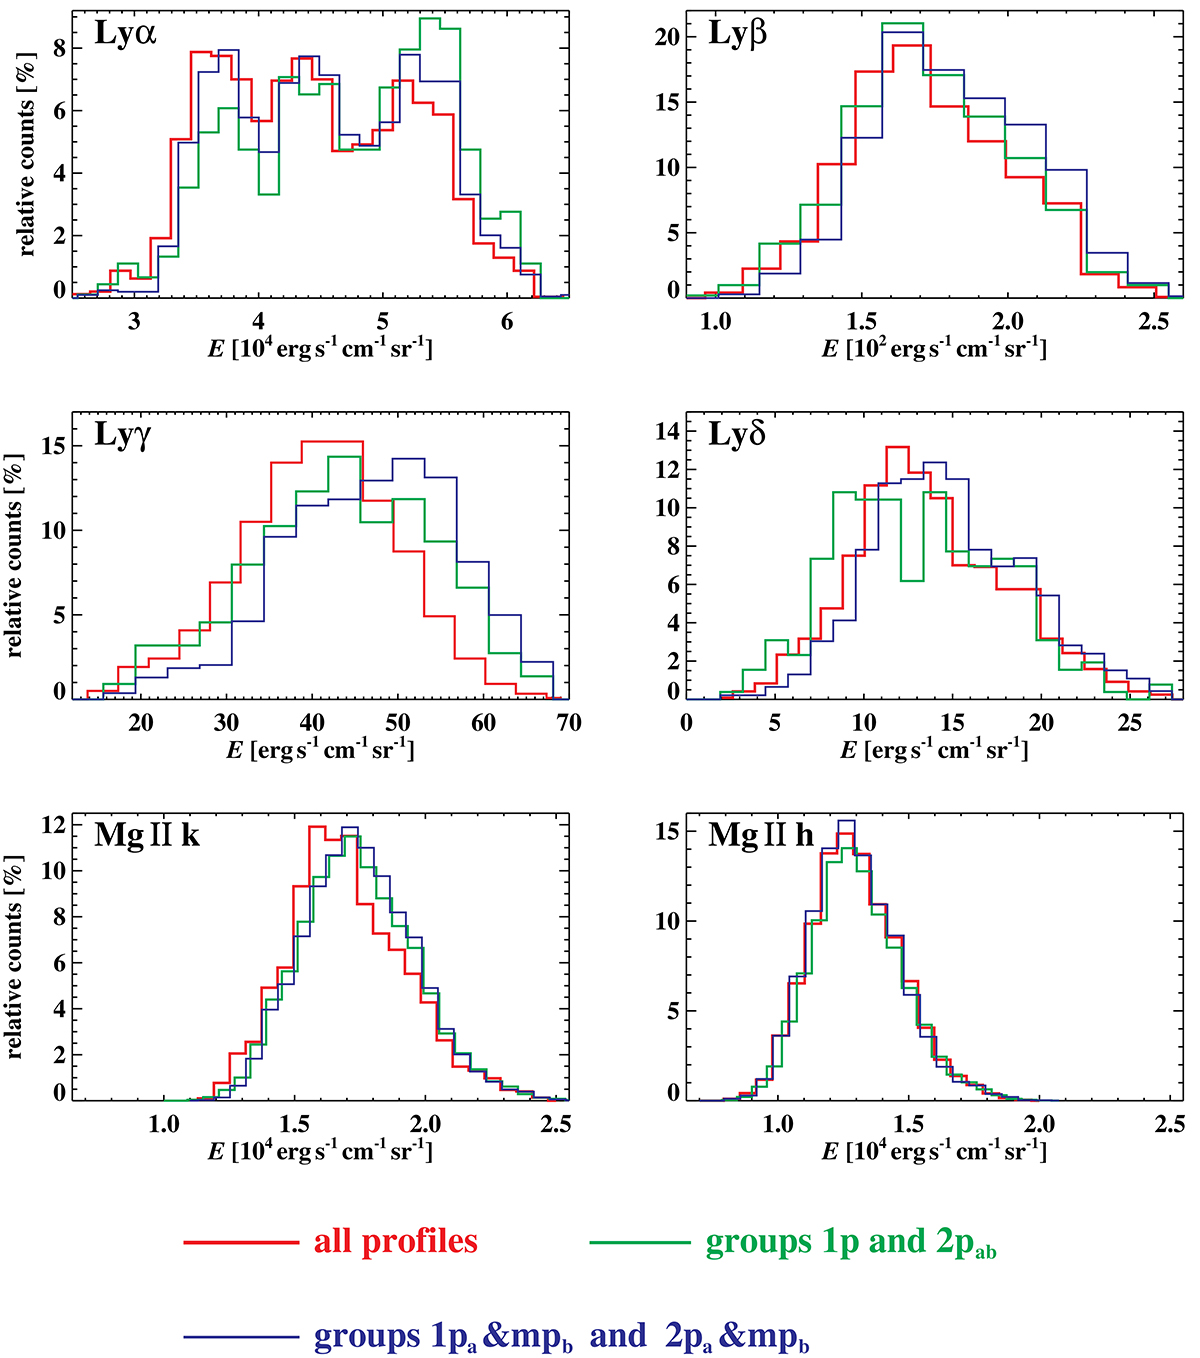
Histograms of the integrated intensities of the Lyα–Lyδ and Mg II k and h lines. Histograms containing all types of profiles are plotted with red, profiles from combination of the groups 1p and 2pab with green, and from combination of the groups 1pa & mpb and 2pa & mpb with the blue color.
Current usage metrics show cumulative count of Article Views (full-text article views including HTML views, PDF and ePub downloads, according to the available data) and Abstracts Views on Vision4Press platform.
Data correspond to usage on the plateform after 2015. The current usage metrics is available 48-96 hours after online publication and is updated daily on week days.
Initial download of the metrics may take a while.