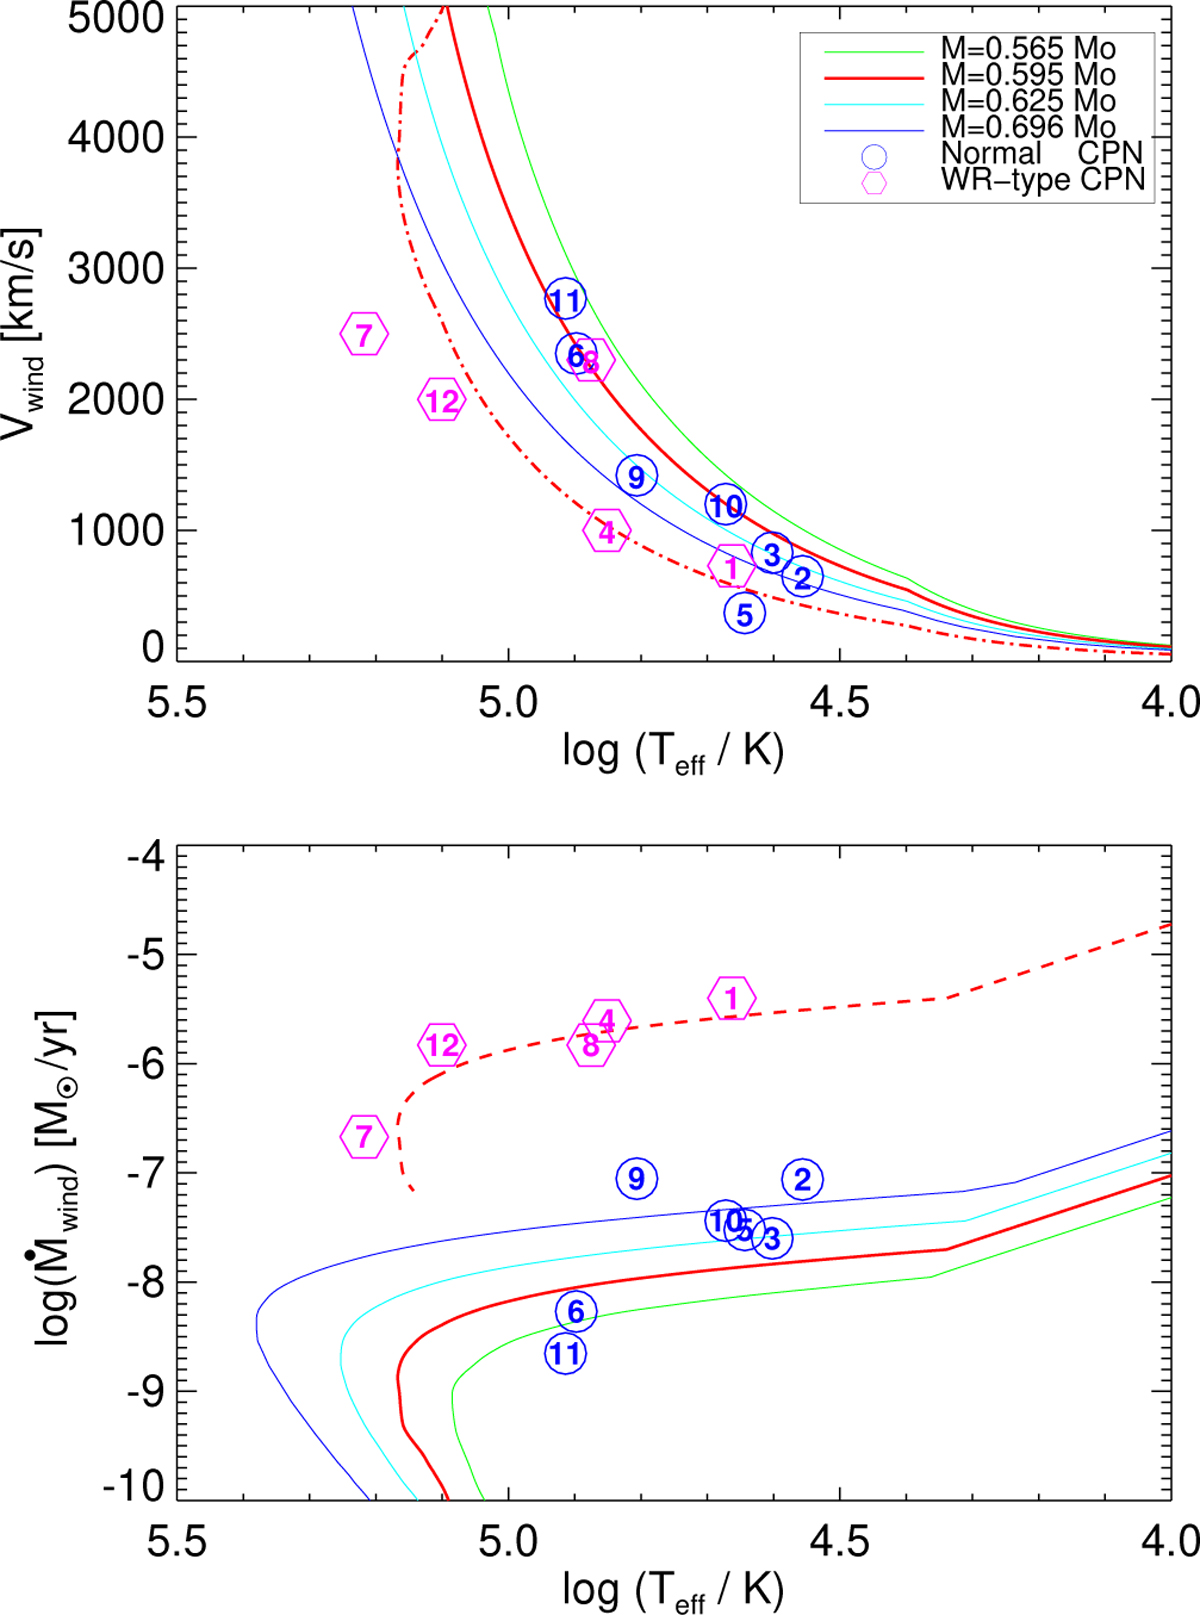
Fig. 8
Download original image
Stellar-wind velocities (top) and mass-loss rates (bottom) versus stellar Teff for the same post-AGB tracks and sample objects as in Fig. 7. The dash-dotted line in the top panel represents the wind velocity of the 0.595 M⊙ model halved, the dashed line in the bottom panel the mass-loss rate of the 0.595 M⊙ model increased by a factor of 200. The positions of the objects no. 6 (NGC 3242) and no. 8 (NGC 5315) nearly coincide in the top panel, and those of no. 5 (NGC 2392) and no. 10 (NGC 6826) in the bottom panel.
Current usage metrics show cumulative count of Article Views (full-text article views including HTML views, PDF and ePub downloads, according to the available data) and Abstracts Views on Vision4Press platform.
Data correspond to usage on the plateform after 2015. The current usage metrics is available 48-96 hours after online publication and is updated daily on week days.
Initial download of the metrics may take a while.