Fig. 5
Download original image
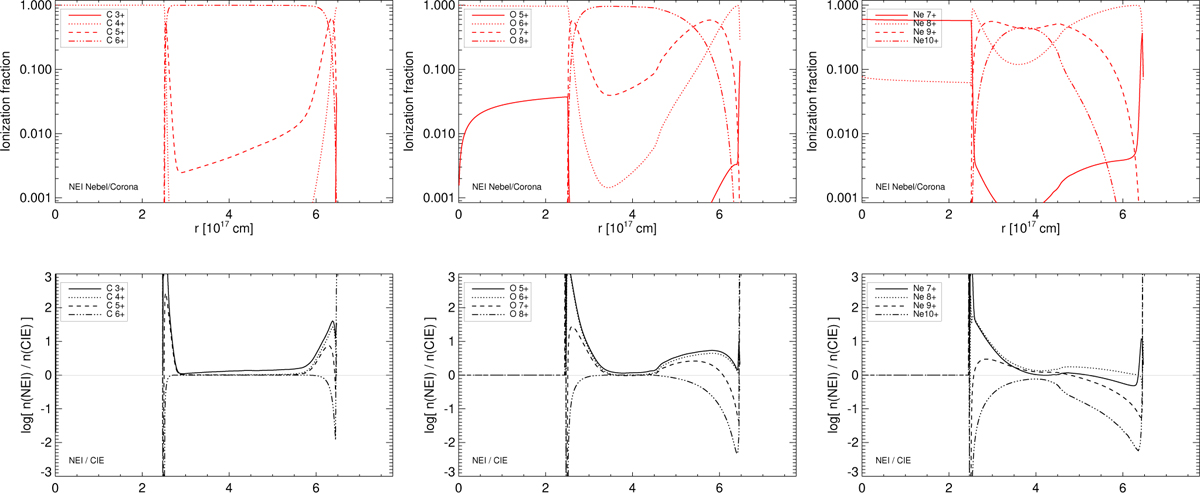
Ionisation structure of the WR100V05 model displayed in Fig. 6. The upper panels show the radial profiles of the NEI ionisation fractions for the last four ionisation stages of carbon (left), oxygen (middle), and neon (right) as computed with NEBEL/CORONA. The NEI to CIE logarithmic number density ratios are plotted in the respective bottom panels. The wind shock is at R1 = 2.5 × 1017 cm, the bubble’s surface (conduction front) at R2 = 6.5 × 1017 cm.
Current usage metrics show cumulative count of Article Views (full-text article views including HTML views, PDF and ePub downloads, according to the available data) and Abstracts Views on Vision4Press platform.
Data correspond to usage on the plateform after 2015. The current usage metrics is available 48-96 hours after online publication and is updated daily on week days.
Initial download of the metrics may take a while.