Open Access
Fig. A.1
Download original image
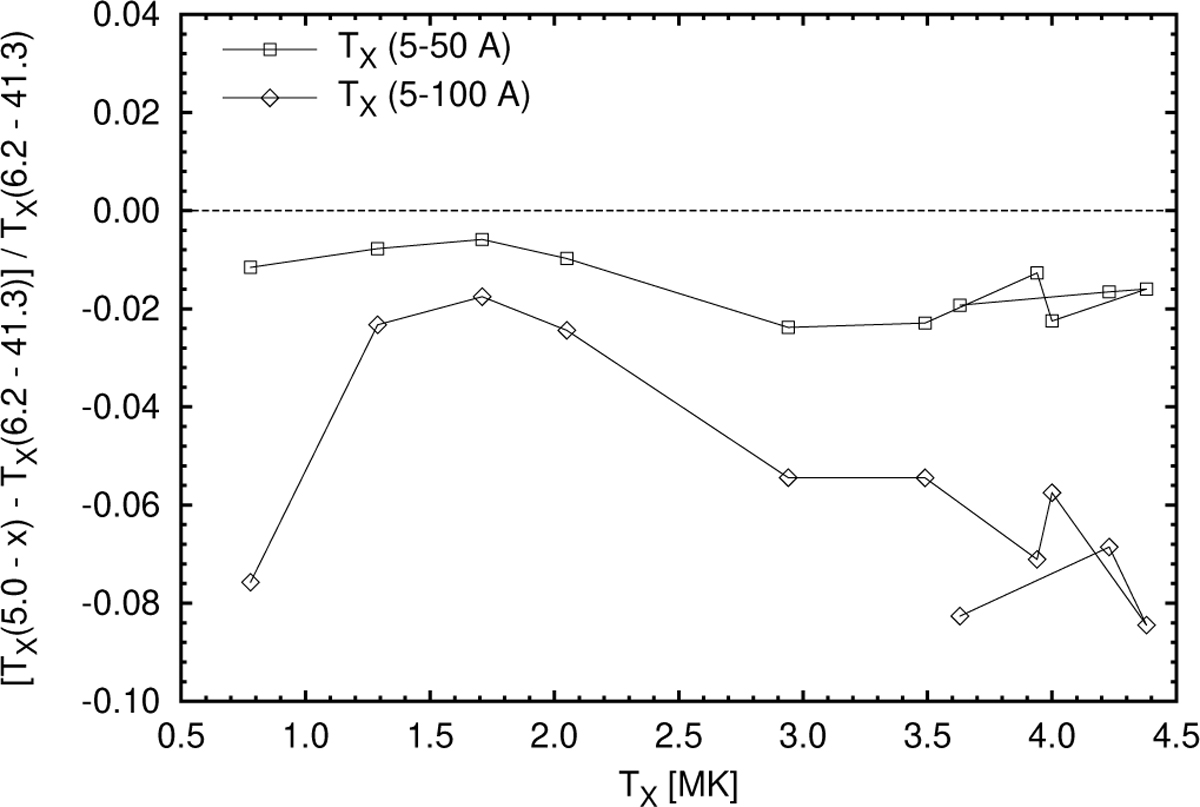
The differences of the Tx values as computed by Eq. (1) for the two selected band widths (legend) relative to the one used in this work (6.2–41.3 Å), assuming CIE. Symbols belong to the PN bubbles of the 0.696 M⊙ simulation. The evolution of Tx occurs from low to high values and back when the star fades (cf. Fig. 13).
Current usage metrics show cumulative count of Article Views (full-text article views including HTML views, PDF and ePub downloads, according to the available data) and Abstracts Views on Vision4Press platform.
Data correspond to usage on the plateform after 2015. The current usage metrics is available 48-96 hours after online publication and is updated daily on week days.
Initial download of the metrics may take a while.