Fig. 16
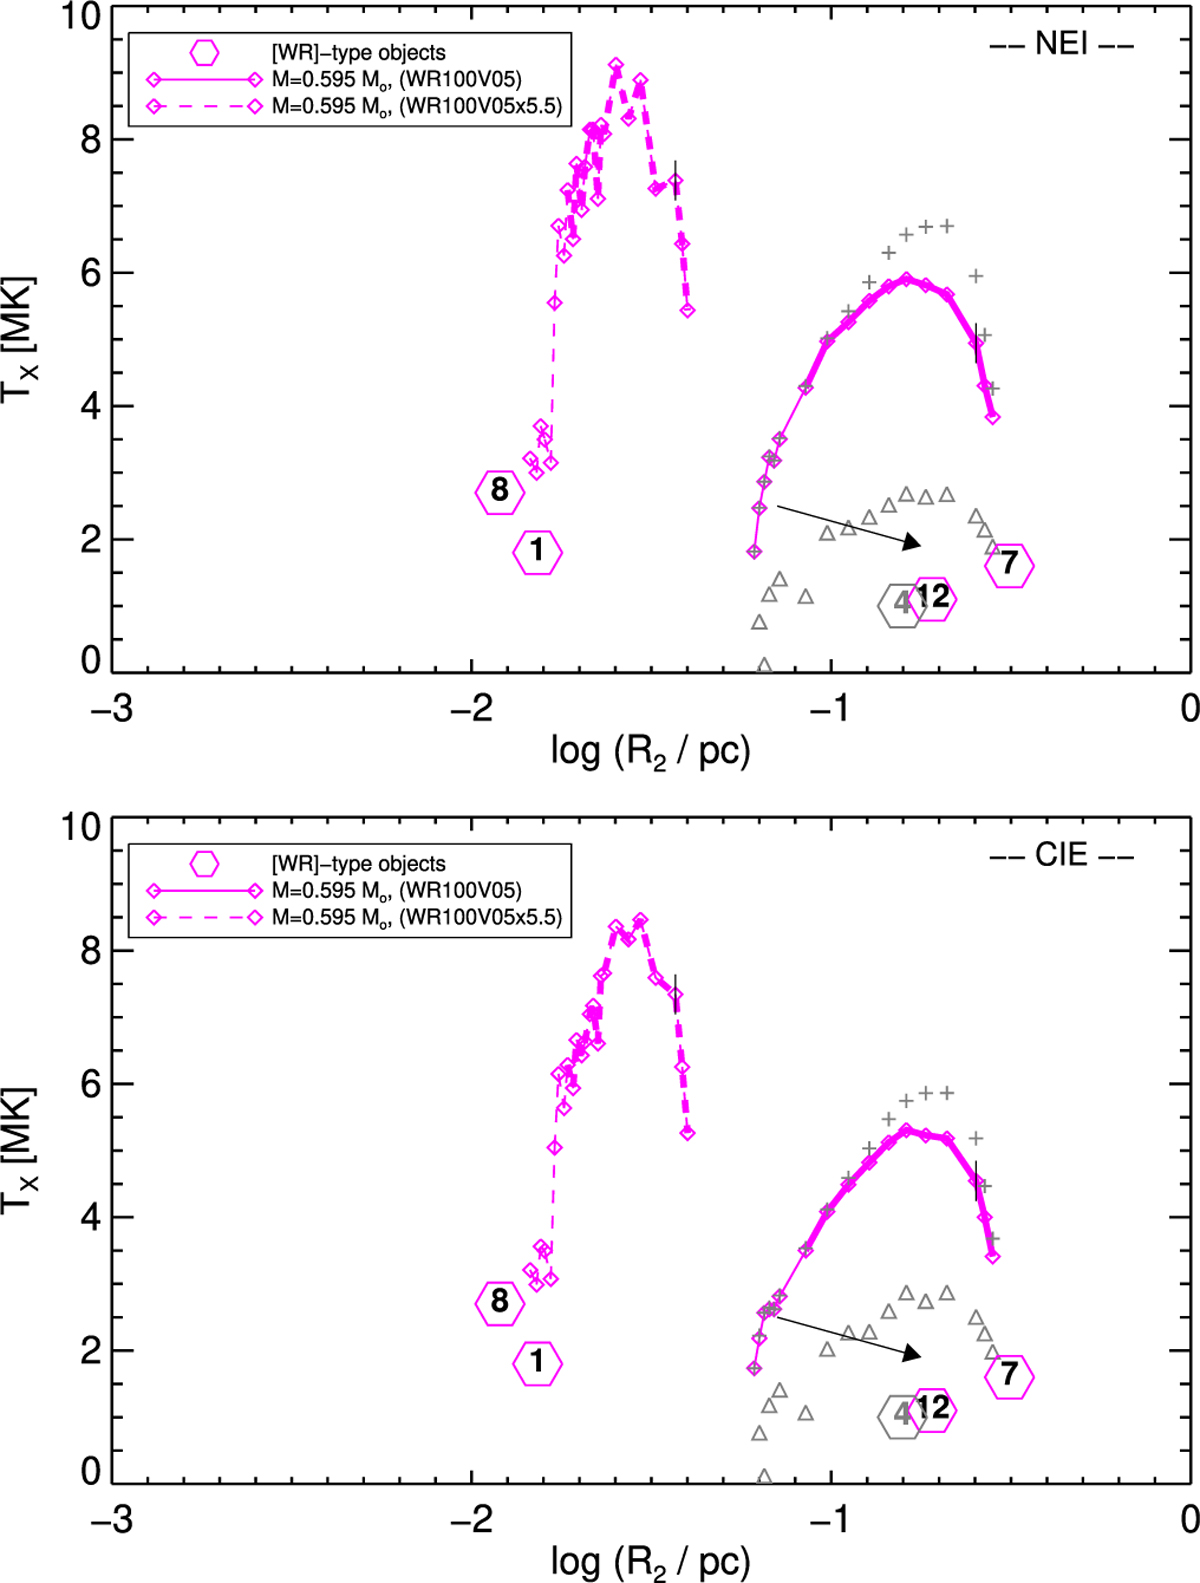
Download original image
Characteristic X-ray temperature TX versus bubble radius R2 for the sequences WR100V05 (right, solid) and WR100V05x5.5 (left, dashed) and the bubbles of our sample (Table 3). Again, bubble evolution occurs from left to right, and maximum stellar temperatures are indicated by a vertical mark. Evaporating bubbles with inhomogeneous composition are connected by thick solid or dashed lines. The mean temperatures of the hydrogen-poor part, TX(WR), and of the hydrogen-rich part, TX(PN), are shown as crosses and triangles, respectively, for the WR100V05 bubbles. As in the previous figure, the arrow indicates the (estimated) shift of the WR100V05 bubbles if the evolutionary timescale is increased by a factor of 2.5. The symbol of NGC 40 (no. 4) is shown in grey because of the large uncertainty of the derived TX value. The top and bottom panel displays the NEI and the CIE case, respectively.
Current usage metrics show cumulative count of Article Views (full-text article views including HTML views, PDF and ePub downloads, according to the available data) and Abstracts Views on Vision4Press platform.
Data correspond to usage on the plateform after 2015. The current usage metrics is available 48-96 hours after online publication and is updated daily on week days.
Initial download of the metrics may take a while.