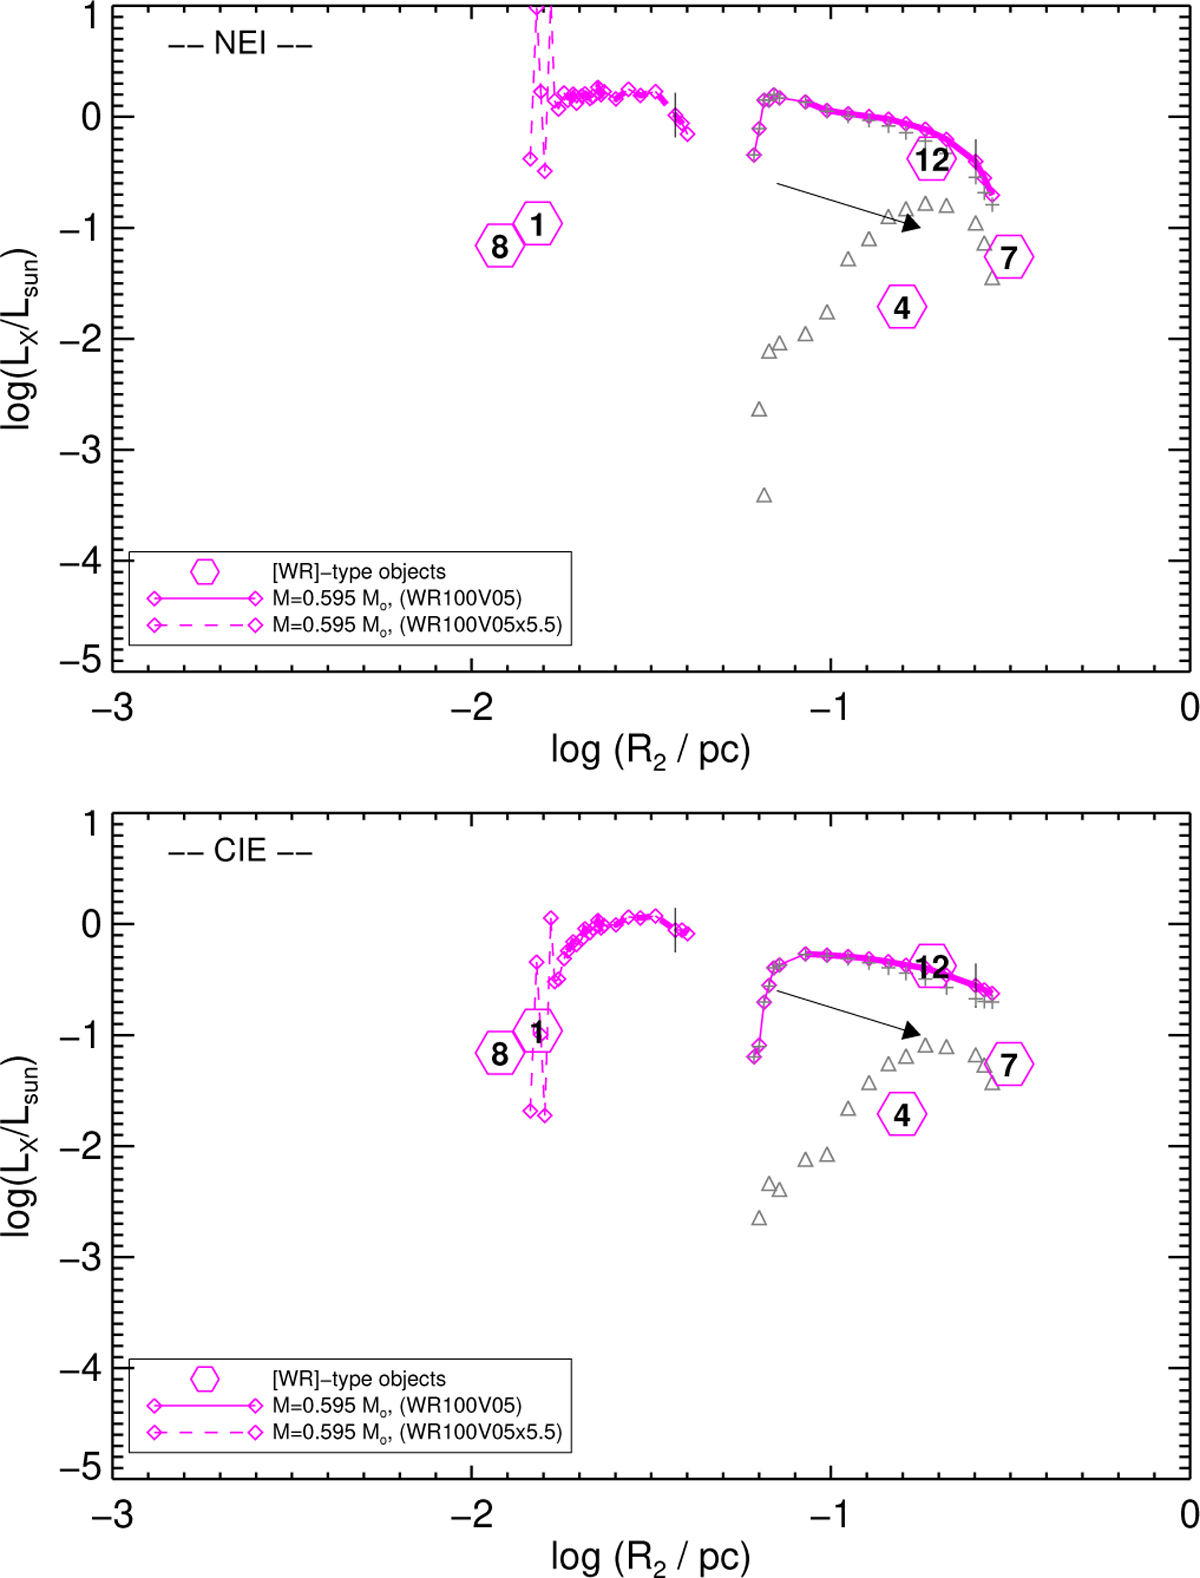
Fig. 15
Download original image
Bubble X-ray luminosities Lx versus bubble radius R2 of the sequences WR100V05 (right, solid) and WR100V05x5.5 (left, dashed) and the bubbles of the [WR]-type sample objects of Table 3. Evolution occurs from left to right, and maximum stellar temperatures are indicated by a vertical mark. Evaporating bubble models are connected by a thick solid or dashed line. The WR100V05 bubbles also contain the information on the luminosity contributions of the hydrogen-poor WR part (crosses) and the evaporated hydrogen-rich PN part (triangles). The arrow indicates the (estimated) shift of the WR100V05 bubbles if the evolutionary timescale is increased by a factor of 2.5. The top panel displays the NEI, the bottom panel the CIE case.
Current usage metrics show cumulative count of Article Views (full-text article views including HTML views, PDF and ePub downloads, according to the available data) and Abstracts Views on Vision4Press platform.
Data correspond to usage on the plateform after 2015. The current usage metrics is available 48-96 hours after online publication and is updated daily on week days.
Initial download of the metrics may take a while.