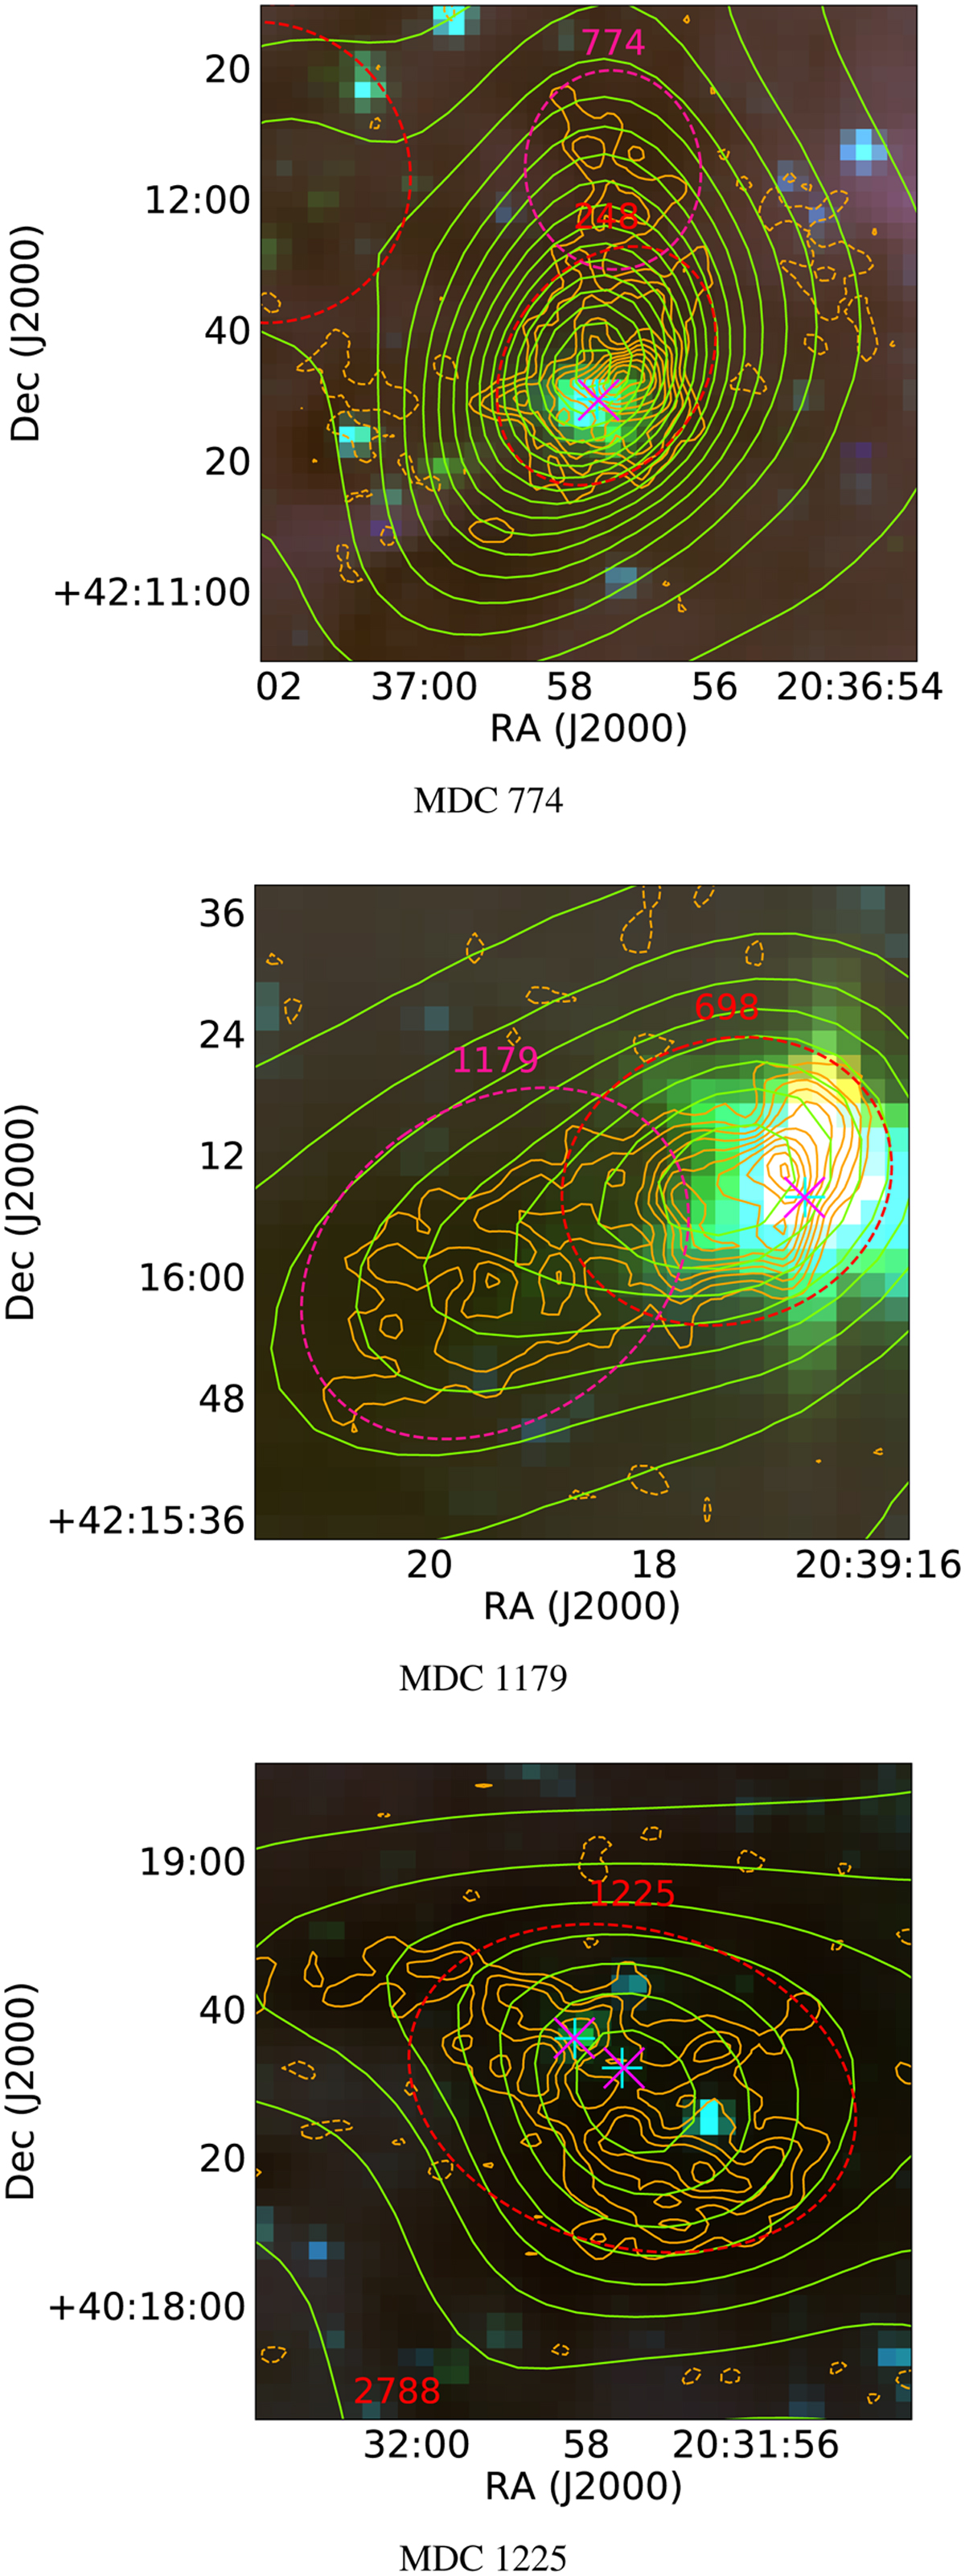
Fig. 8
Download original image
MDCs at the Ml stage (i.e., the NH3 (1,1) emission is roughly concentrated around the column density peaks). The background is pseudo three-color images of each field, with Spitɀer 8, 4.5, and 3.6 µm emission colored in red, green, and blue, respectively. The contours of H2 column density and NH3 (1,1) integrated emission are over-plotted with green and orange, respectively. Cyan and magenta crosses mark the positions of any H2O masers or radio continuum sources, respectively. The starless, IR-quiet, and IR-bright MDCs are shown as pink dashed, red dashed, and red solid ellipses, respectively. More figures are showed in Appendix C.
Current usage metrics show cumulative count of Article Views (full-text article views including HTML views, PDF and ePub downloads, according to the available data) and Abstracts Views on Vision4Press platform.
Data correspond to usage on the plateform after 2015. The current usage metrics is available 48-96 hours after online publication and is updated daily on week days.
Initial download of the metrics may take a while.