Fig. 7
Download original image
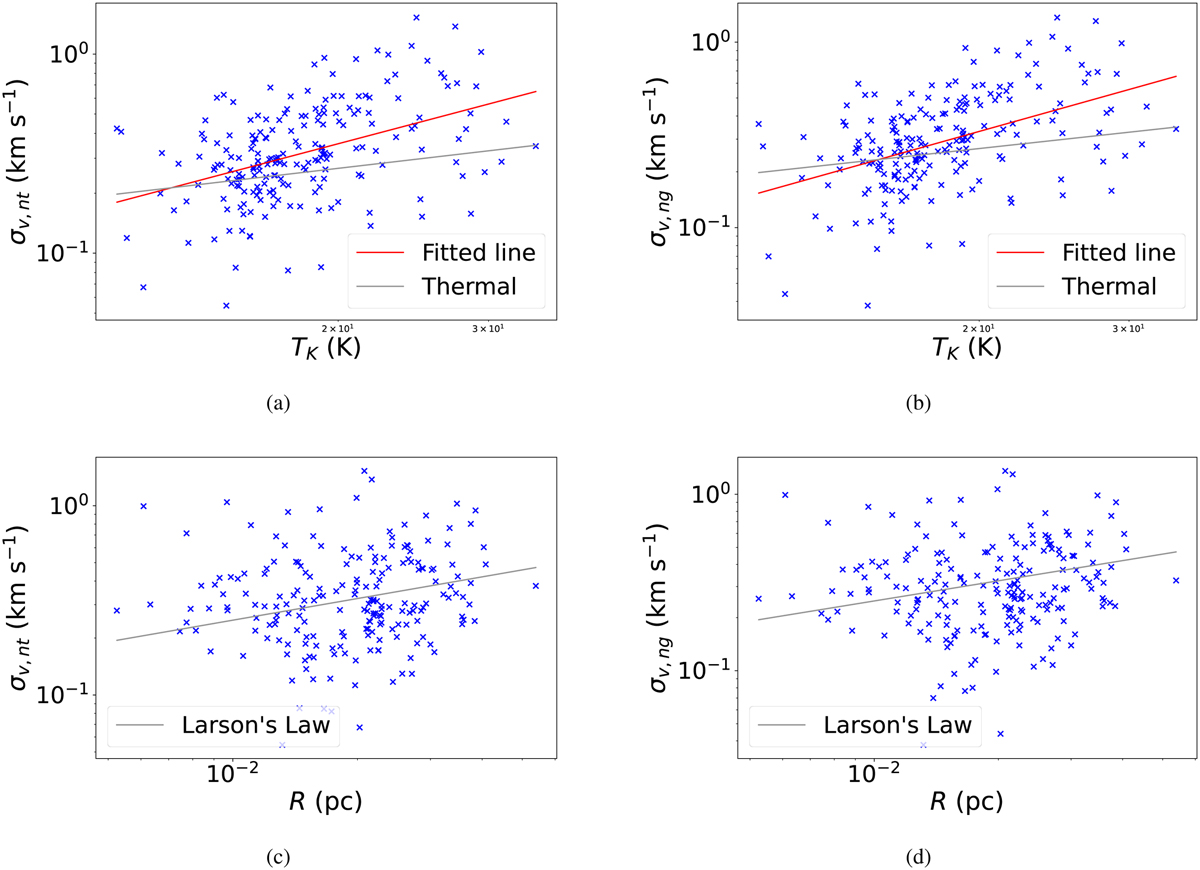
Correlations between physical parameters of NH3 fragments. Panels a and b plot nonthermal velocity dispersions including or excluding the bulk motions versus kinetic temperature. The red and gray lines show the fitted result of the linear regression and the thermal velocity dispersion. There are positive correlations in both of them. Panels c and d plot nonthermal velocity dispersions including or excluding the bulk motions versus deconvolved radius. The gray line shows Larson’s law.
Current usage metrics show cumulative count of Article Views (full-text article views including HTML views, PDF and ePub downloads, according to the available data) and Abstracts Views on Vision4Press platform.
Data correspond to usage on the plateform after 2015. The current usage metrics is available 48-96 hours after online publication and is updated daily on week days.
Initial download of the metrics may take a while.