Fig. 2
Download original image
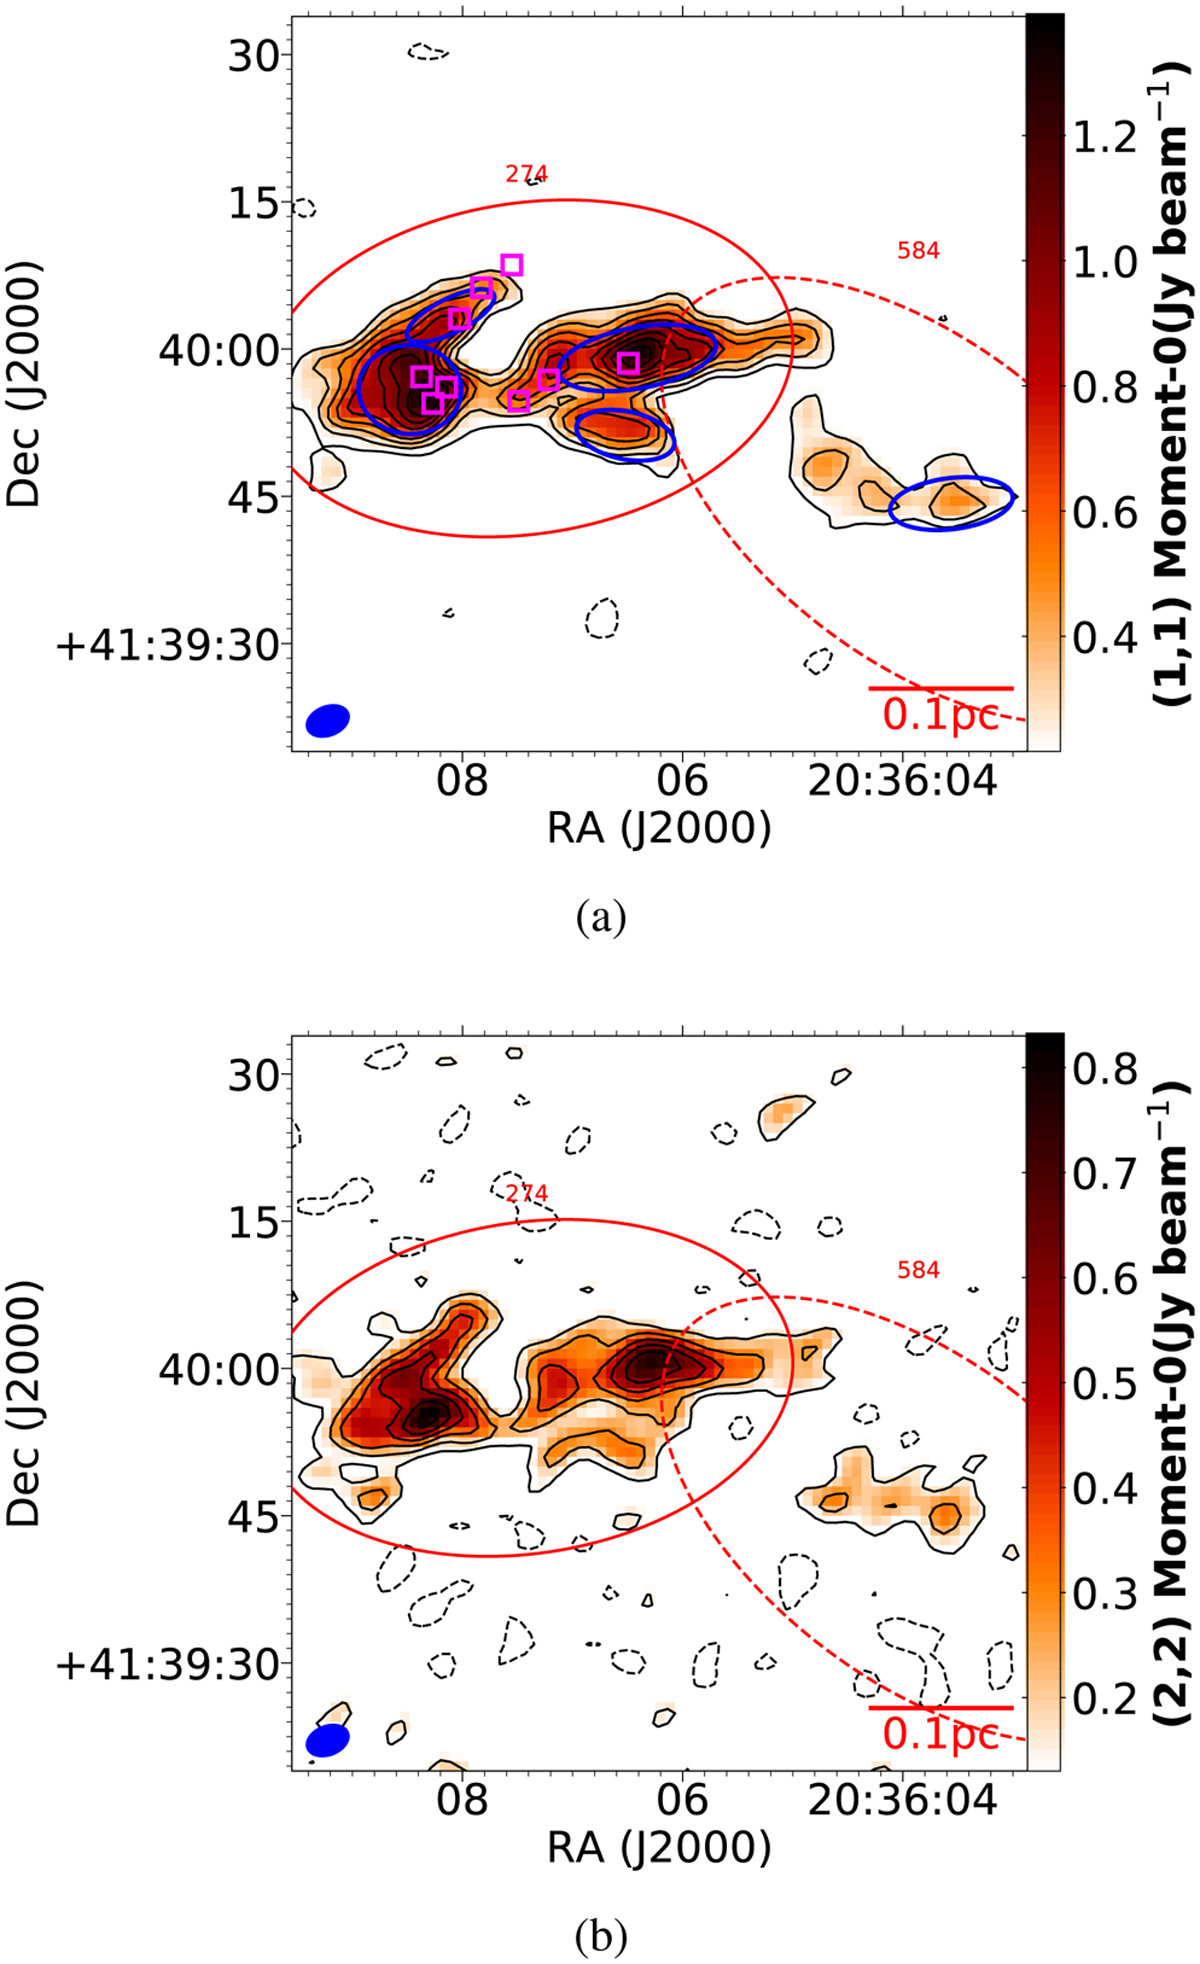
(a) Moment-0 map of the NH3 (1,1) line for Field 3. The contour is plotted from 3σ level and in steps of 2σ. The red ellipses show the MDCs identified from the H2 column density map (resolution ~20″) by Cao et al. (2021), and the blue ellipses illustrate the fragments extracted using the GAUSSCLUMPS algorithm. The magenta boxes show the condensations identified from the SMA 1.3 mm continuum, (b) Moment-0 map of the NH3 (2,2) line for Field 3. The contour is plotted from 2σ level and in steps of 2σ.
Current usage metrics show cumulative count of Article Views (full-text article views including HTML views, PDF and ePub downloads, according to the available data) and Abstracts Views on Vision4Press platform.
Data correspond to usage on the plateform after 2015. The current usage metrics is available 48-96 hours after online publication and is updated daily on week days.
Initial download of the metrics may take a while.