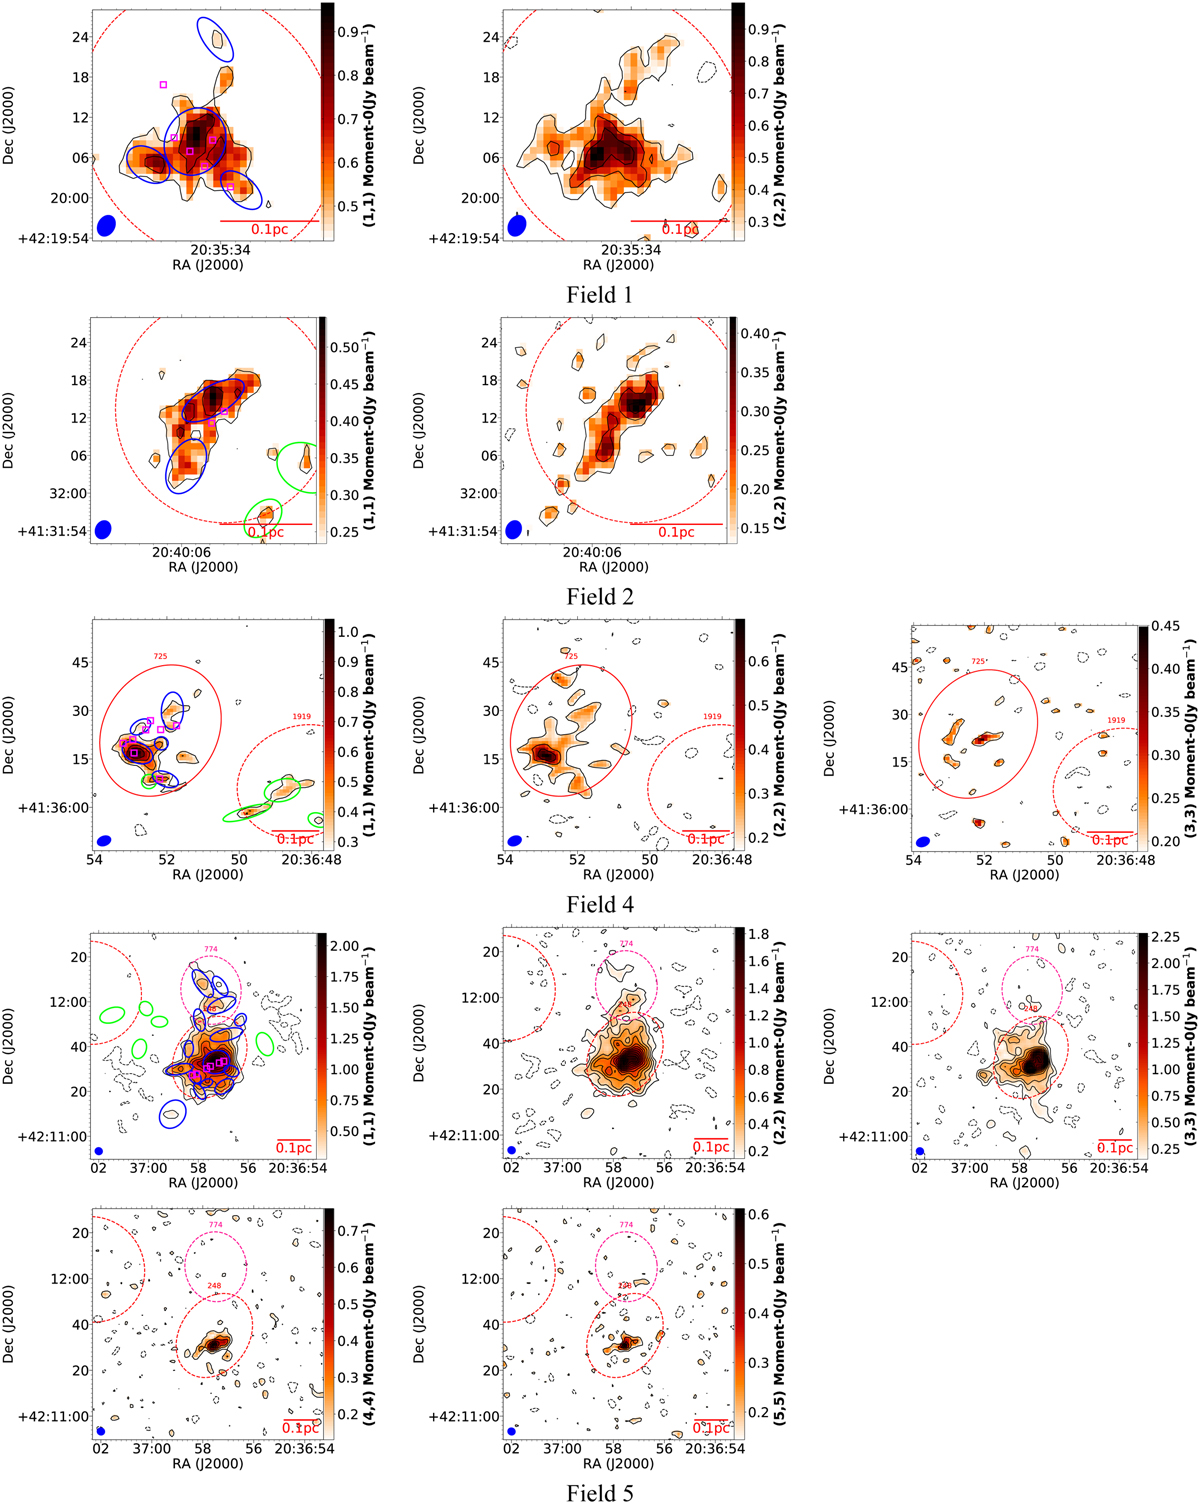
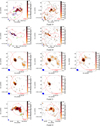
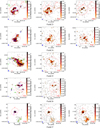
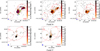
Fig. A.1
Download original image
Moment-0 maps with remarkable detection of NH3 (J,K) = (1,1), (2,2), (3,3), (4,4), and (5,5) inversion lines among our observations. The (1,1) maps are plotted from a 3 rms level and in steps of 2σ, while others are plotted from the 2 rms level and in steps of 2σ. The IR-bright, IR-quiet, and starless MDCs are shown as red solid, red dashed, and pink dashed ellipses, respectively. The smaller ellipses present the fragments extracted using the GAUSSCLUMPS algorithm. The blue ones are included in the parameter analysis while the green ones are not.

Current usage metrics show cumulative count of Article Views (full-text article views including HTML views, PDF and ePub downloads, according to the available data) and Abstracts Views on Vision4Press platform.
Data correspond to usage on the plateform after 2015. The current usage metrics is available 48-96 hours after online publication and is updated daily on week days.
Initial download of the metrics may take a while.