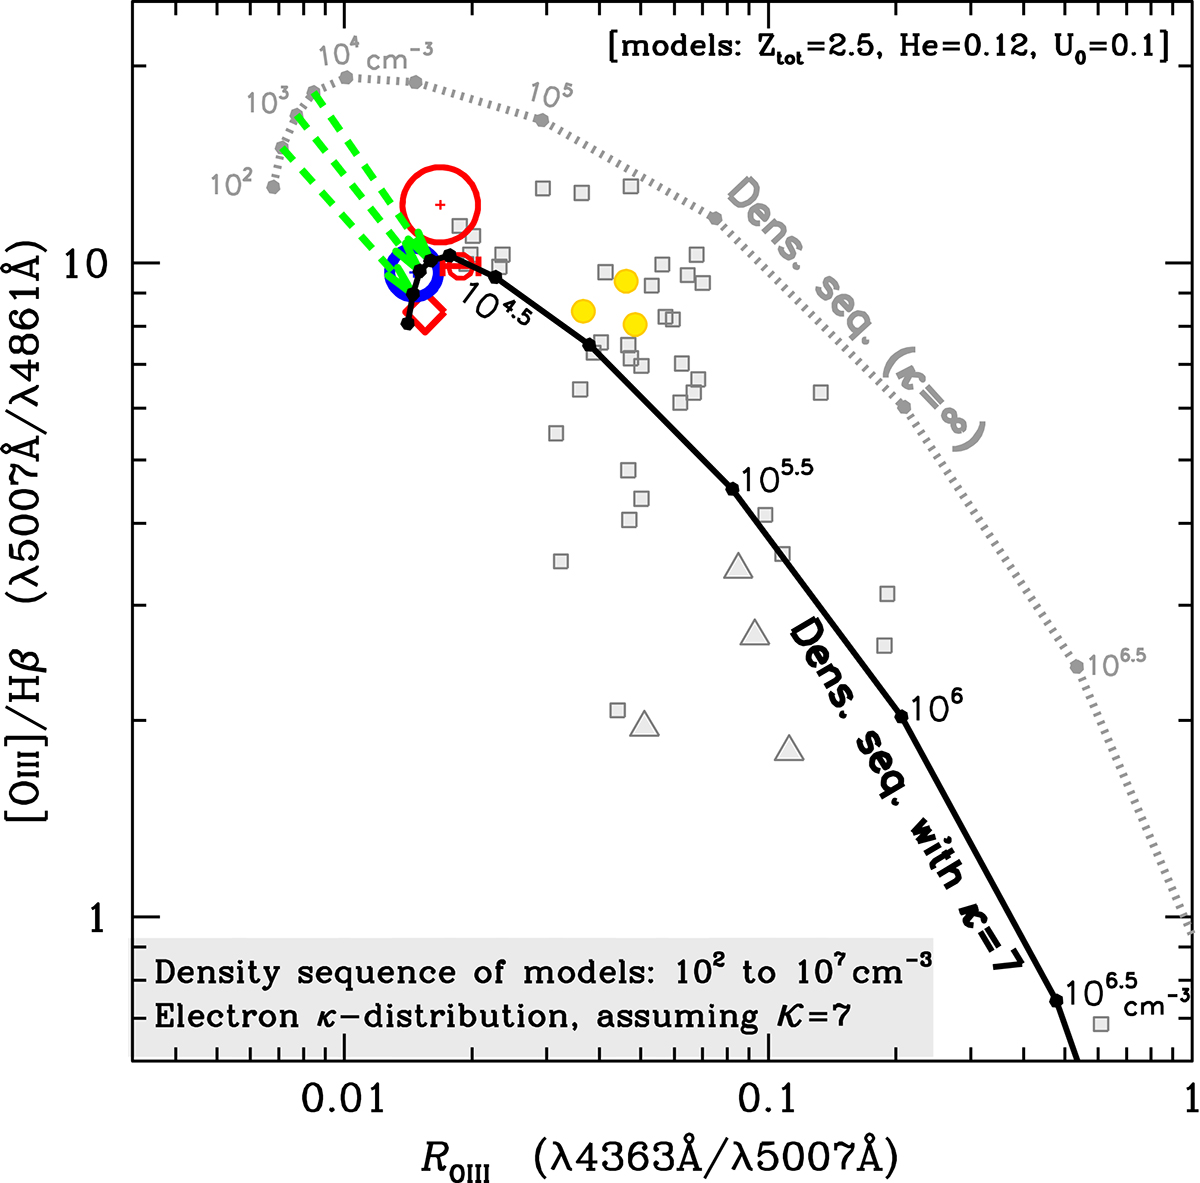
Fig. 9.
Download original image
Dereddened NLR ratios of [O III]/Hβ versus ROIII for the same observational dataset as in Fig. 4. The gray dotted line consists of radiation pressure stratified ionization-bounded models with Uo = 0.1 assuming the Fg97 SED with Tcut = 106 K. The frontal density along the sequence varies from ![]() up to 107 cm−3, in steps of 0.5 dex (as in Fig. 7). The black line represents a similar density sequence but assuming a non-Maxwellian κ-distribution of electron kinetic energies with κ = 7. The light-green dashed arrows describe the change in ROIII ratios resulting from the selected κ-distribution with κ = 7.
up to 107 cm−3, in steps of 0.5 dex (as in Fig. 7). The black line represents a similar density sequence but assuming a non-Maxwellian κ-distribution of electron kinetic energies with κ = 7. The light-green dashed arrows describe the change in ROIII ratios resulting from the selected κ-distribution with κ = 7.
Current usage metrics show cumulative count of Article Views (full-text article views including HTML views, PDF and ePub downloads, according to the available data) and Abstracts Views on Vision4Press platform.
Data correspond to usage on the plateform after 2015. The current usage metrics is available 48-96 hours after online publication and is updated daily on week days.
Initial download of the metrics may take a while.