Fig. 7.
Download original image
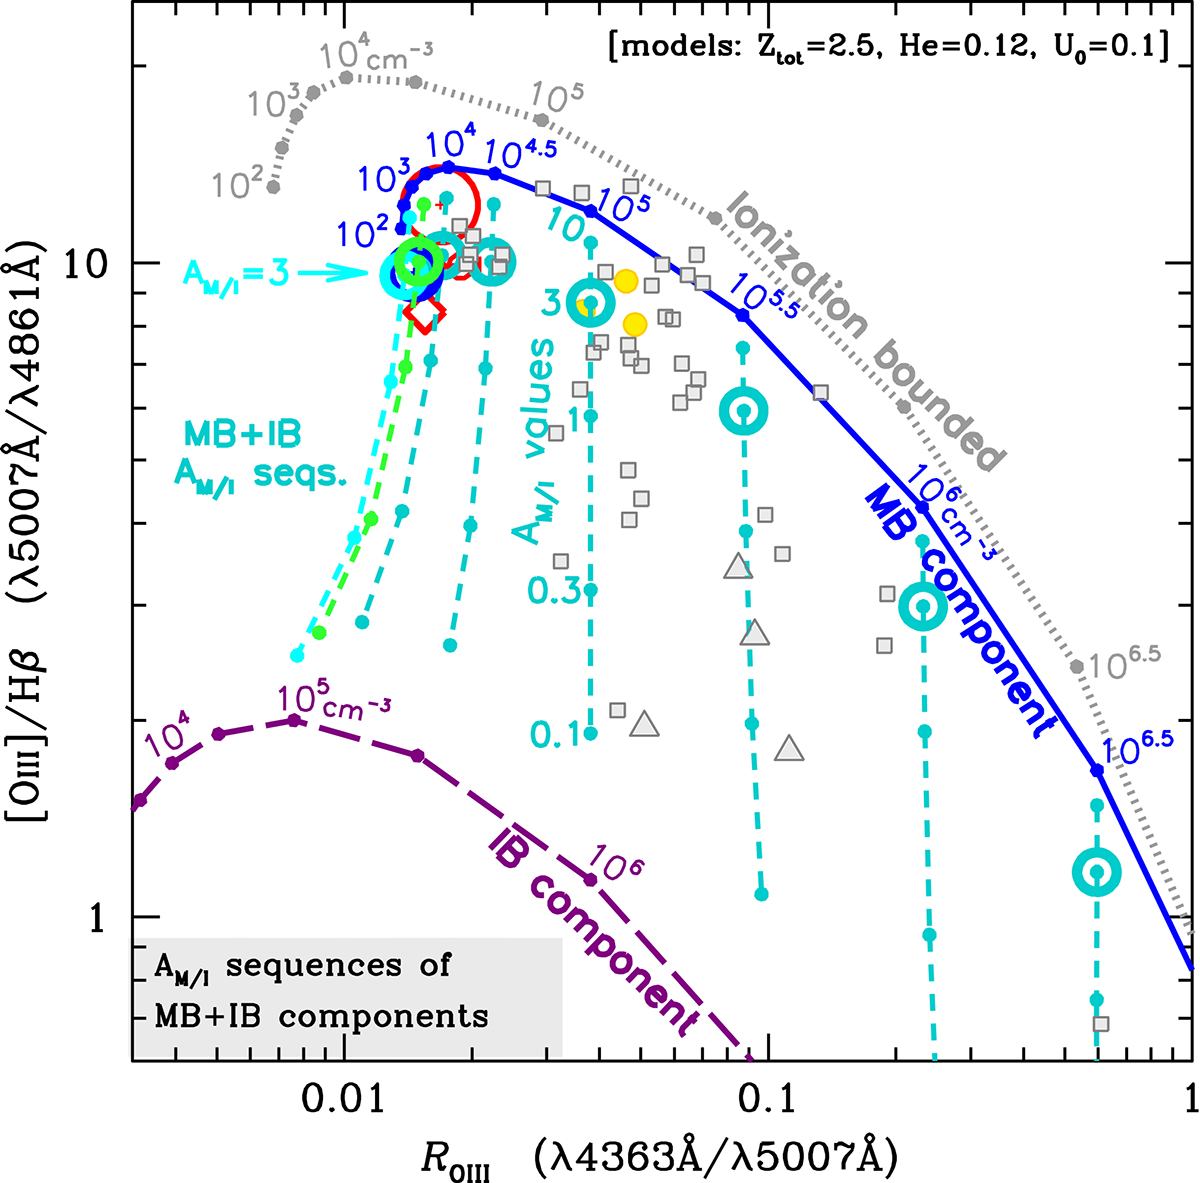
Dereddened NLR ratios of [O III]/Hβ versus ROIII for the same observational dataset as in Fig. 4. The blue solid line represent the sequence of MB models in which the frontal densities varied from ![]() up to 107 cm−3, in steps of 0.5 dex, assuming in all cases Uo = 0.1. The gray dotted line represents photoionization models that assumed the same parameters as the MB sequence except that the models are ionization-bounded. In both sequences the cloud internal density is stratified due to the pressure exerted by absorption of the ionizing continuum. The purple line represents the density sequence for the IB component in which the ionizing continuum consisted of the radiation (further diluted by a factor 20) which leaks out from the back of the MB clouds. In all calculations, the assumed ionizing continuum corresponded to the thermal distribution of Fg97 with Tcut = 106 K. The eight (near vertical) short-dash lines correspond to a linear combination of the MB model of density
up to 107 cm−3, in steps of 0.5 dex, assuming in all cases Uo = 0.1. The gray dotted line represents photoionization models that assumed the same parameters as the MB sequence except that the models are ionization-bounded. In both sequences the cloud internal density is stratified due to the pressure exerted by absorption of the ionizing continuum. The purple line represents the density sequence for the IB component in which the ionizing continuum consisted of the radiation (further diluted by a factor 20) which leaks out from the back of the MB clouds. In all calculations, the assumed ionizing continuum corresponded to the thermal distribution of Fg97 with Tcut = 106 K. The eight (near vertical) short-dash lines correspond to a linear combination of the MB model of density ![]() with the IB model with density
with the IB model with density ![]() . The proportion between the two components was set by the parameter AM/I, which successively took on the values of 10, 3, 1, 0.3 and 0.1. A circle identifies models with AM/I = 3. To avoid confusion due to the close superposition of the low density sequences, the AM/I sequences with
. The proportion between the two components was set by the parameter AM/I, which successively took on the values of 10, 3, 1, 0.3 and 0.1. A circle identifies models with AM/I = 3. To avoid confusion due to the close superposition of the low density sequences, the AM/I sequences with ![]() and 102.5 cm−3 were left out.
and 102.5 cm−3 were left out.
Current usage metrics show cumulative count of Article Views (full-text article views including HTML views, PDF and ePub downloads, according to the available data) and Abstracts Views on Vision4Press platform.
Data correspond to usage on the plateform after 2015. The current usage metrics is available 48-96 hours after online publication and is updated daily on week days.
Initial download of the metrics may take a while.