Fig. 4.
Download original image
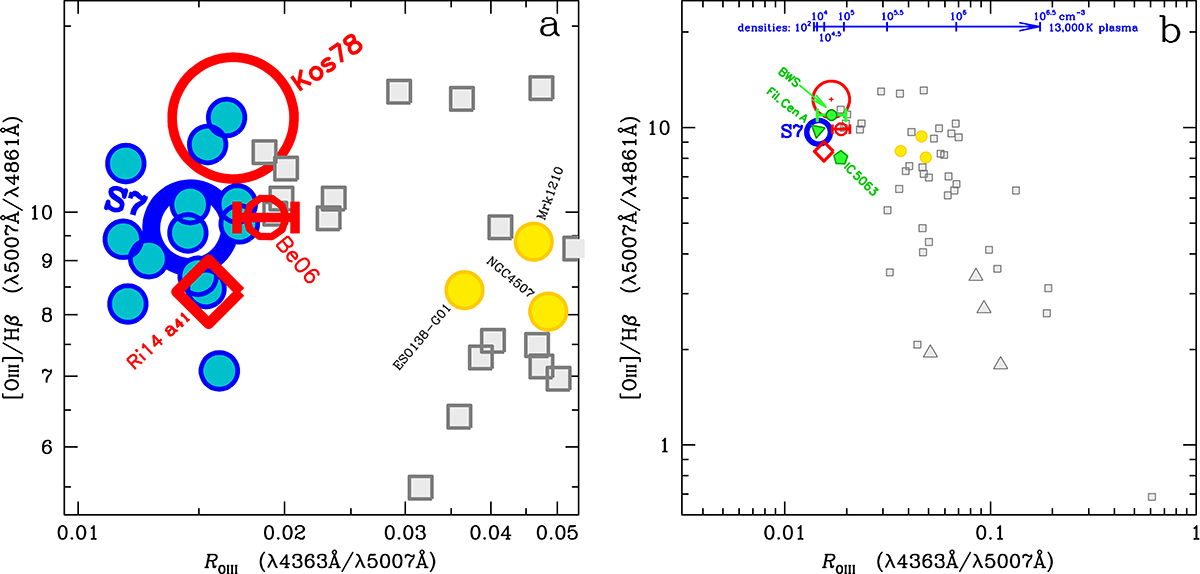
Dereddened NLR ratios of [O III]/Hβ versus ROIII. Left panel a: blue dots represent the line ratios of 13 Seyfert 2s from the S7 survey sample which are listed in Table 1. Their average ROIII ratio is 0.0146 ± 0.0020, which is represented by the navy colored circle whose radius of 0.057 dex corresponds to the dispersion of the measurements. The yellow filled dots identifies the three outlier Seyfert 2s: ESO 138-G01, Mrk 1210 and NGC 4507 (labeled a, b, c in Table 1). Three complementary Seyfert 2 samples are represented by red open symbols: (1) the average of seven Seyfert 2s from Kos78 studied by BVM (large red circle), (2) the average of four Seyfert 2s from Be06b (small open circle with dispersion bars), (3) the high excitation Seyfert 2 subset a41 from Richardson et al. (2014; open red diamond). The light-gray open squares represent the ratios of Type I AGNs measured by BL05. Right panel b: a similar graph but with an expanded scale in order to cover the full range of ratios observed by BL05 among 30 quasars. The light-gray open triangles represent the four narrow-line Seyfert 1 galaxies observed by RA00. Both BL05 and RA00 subtracted the BLR profile component from Hβ before deriving the [O III]/Hβ ratio. The light-green filled symbols represent the spatially resolved ENLR measurements from three studies: (1) the average of two Seyfert 2s and two NLRGs (small light-green dot) from BWS, (2) the integrated long-slit spectrum of the Seyfert 2 IC 5063 from Be06b (pentagon), (3) the average of seven spatially resolved optical filaments of the radio-galaxy Centaurus A (light-green triangle) from Mo91. The blue segmented arrow at the top describes the effect of collisional deexcitation on the ROIII ratio for a 13 000 K isothermal plasma whose density is increased to successively larger values, from 102 to 106.5 cm−3.
Current usage metrics show cumulative count of Article Views (full-text article views including HTML views, PDF and ePub downloads, according to the available data) and Abstracts Views on Vision4Press platform.
Data correspond to usage on the plateform after 2015. The current usage metrics is available 48-96 hours after online publication and is updated daily on week days.
Initial download of the metrics may take a while.