Fig. 3.
Download original image
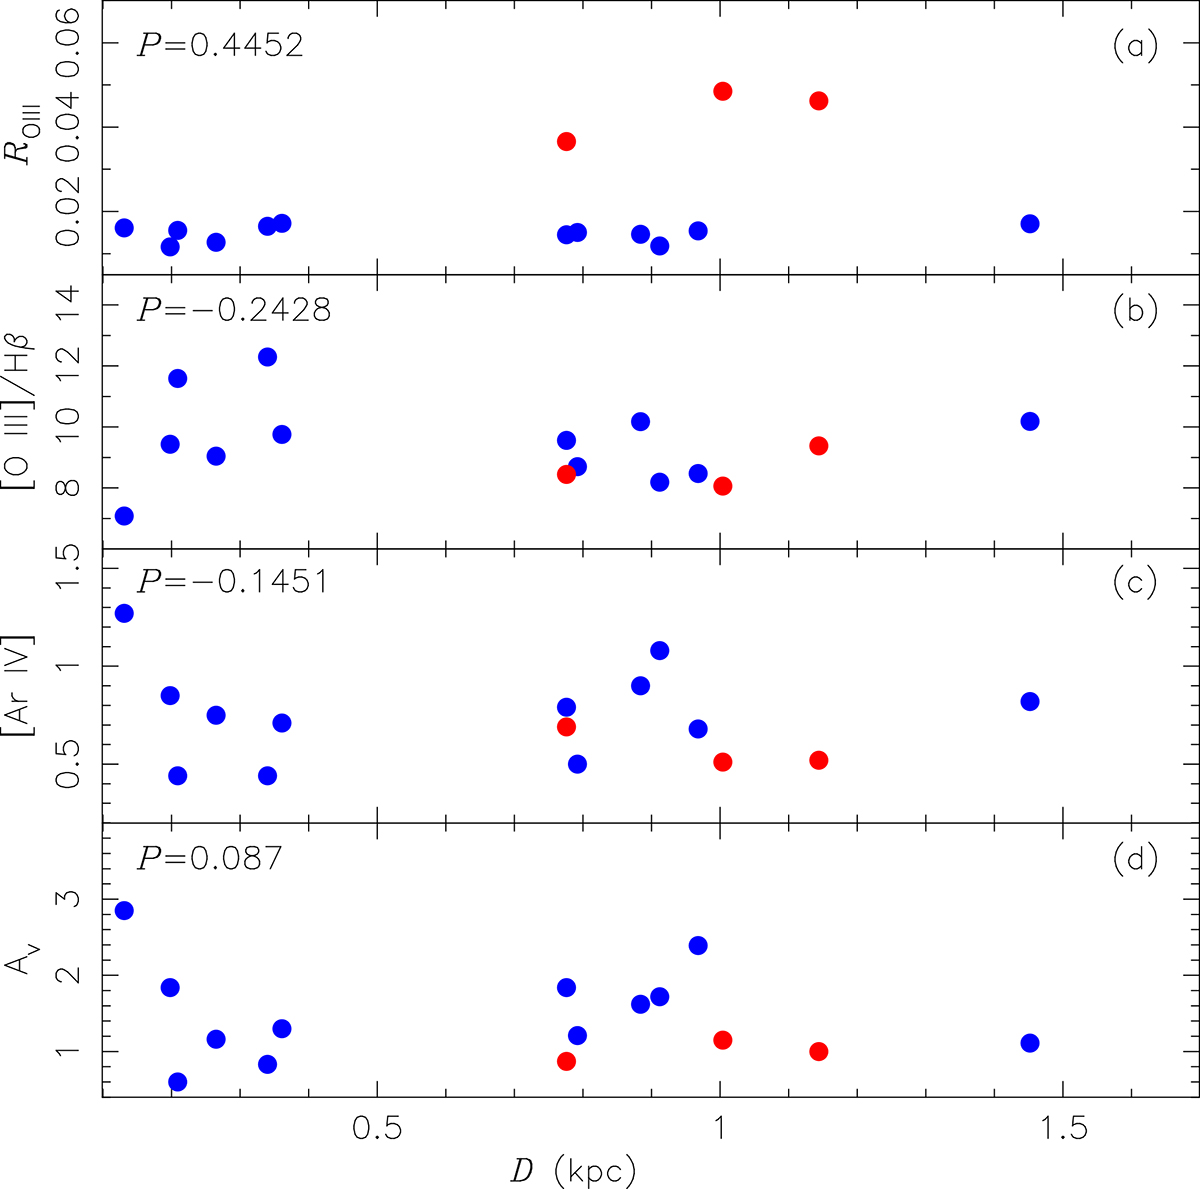
Pearson correlation coefficients for our sample of high excitation Seyfert 2s from the S7 survey. From bottom to top panel, the V band extinction in magnitudes AV and the extinction corrected values of observed [Ar IV]+ (λ4711Å+/λ4740Å), [O III] (λ5007Å/λ4861Å) and ROIII line ratios (Tables 1 and 2) versus the aperture D (in kpc) used to extract the spectra. The value of the Pearson correlation coefficient (P) is indicated in each panel. The red points identify the three outliers discussed in Sect. 3.5.
Current usage metrics show cumulative count of Article Views (full-text article views including HTML views, PDF and ePub downloads, according to the available data) and Abstracts Views on Vision4Press platform.
Data correspond to usage on the plateform after 2015. The current usage metrics is available 48-96 hours after online publication and is updated daily on week days.
Initial download of the metrics may take a while.