Fig. 3
Download original image
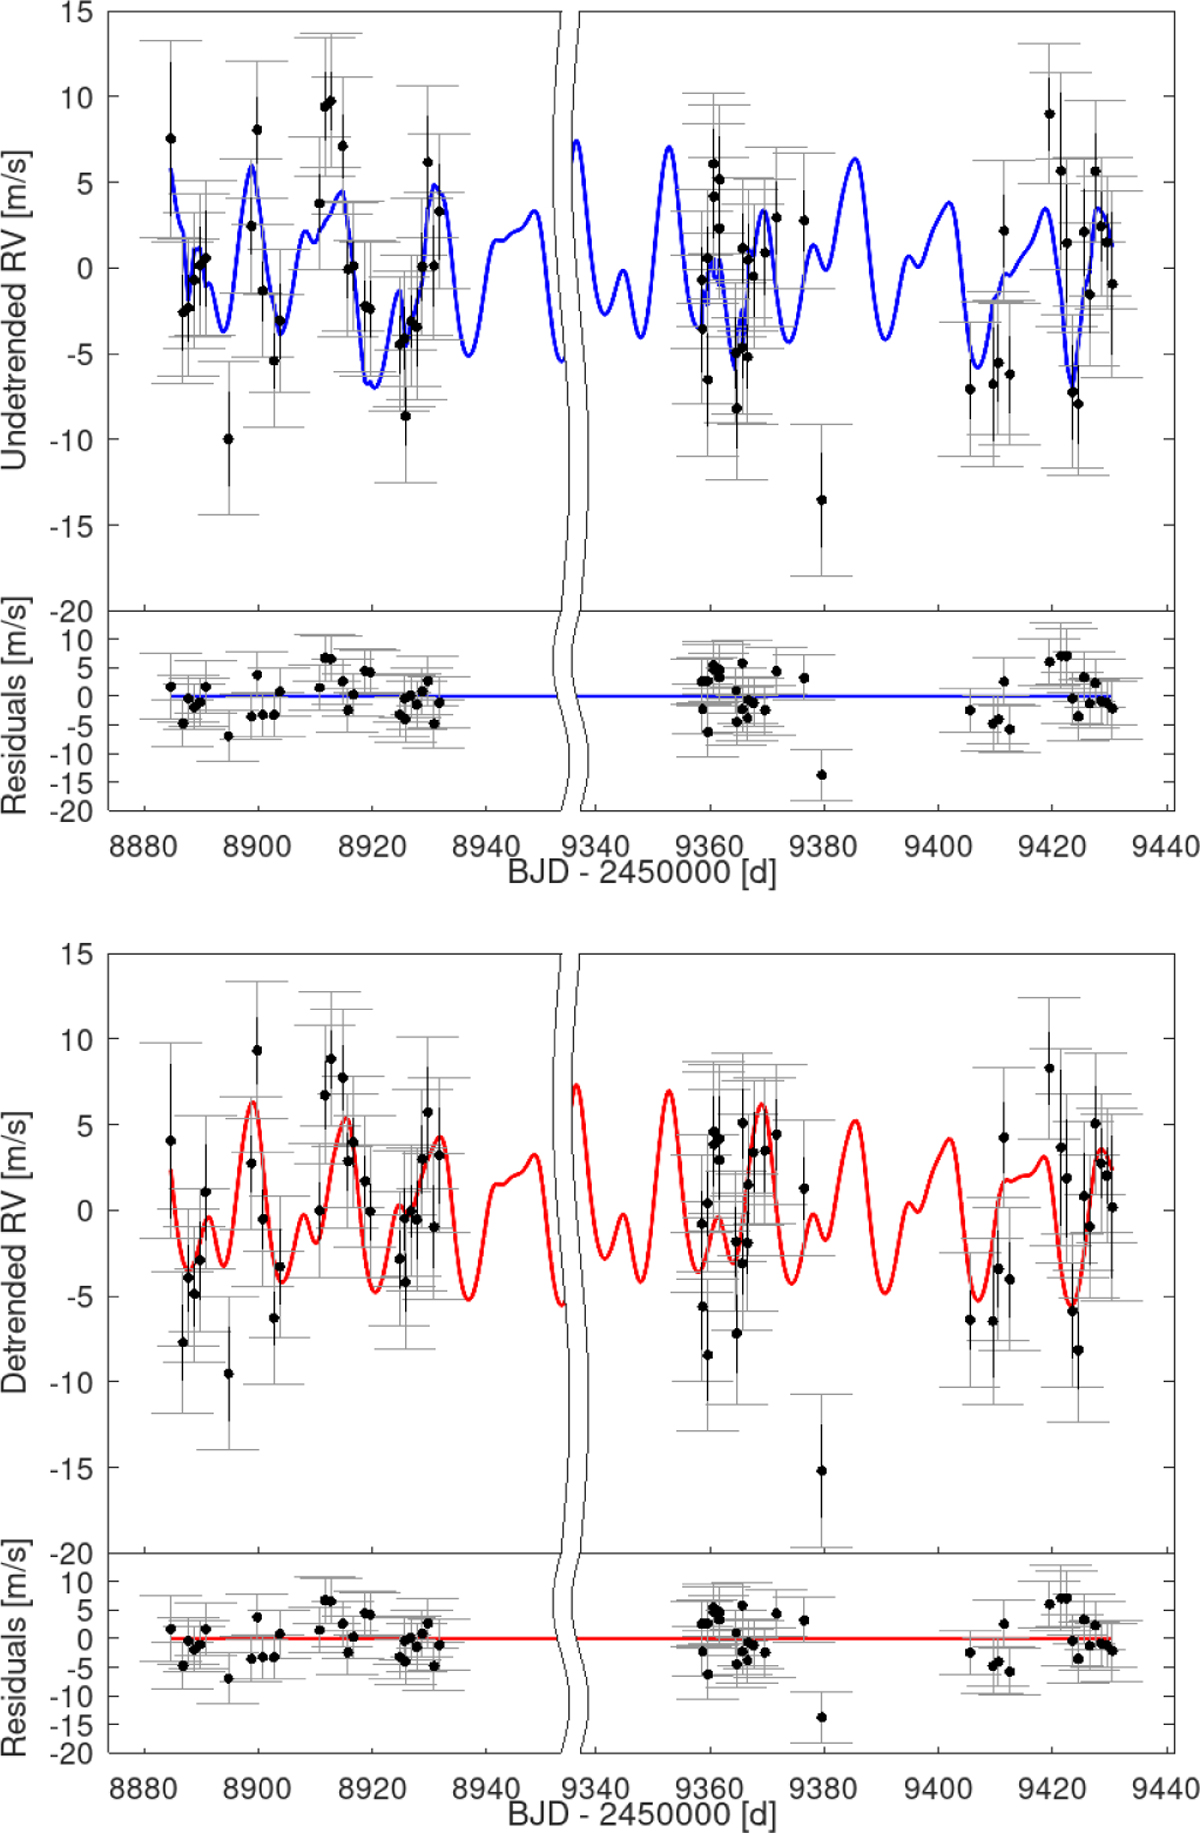
Whole RV time series: the break on the temporal axis avoids the big gap in the data collection and improves the visualisation. Top panel: undetrended RV data with the model of the full Keplerian signal + stellar activity superimposed in blue. Bottom panel: detrended RV data with the model of the full Keplerian signal superimposed in red.
Current usage metrics show cumulative count of Article Views (full-text article views including HTML views, PDF and ePub downloads, according to the available data) and Abstracts Views on Vision4Press platform.
Data correspond to usage on the plateform after 2015. The current usage metrics is available 48-96 hours after online publication and is updated daily on week days.
Initial download of the metrics may take a while.