Fig. 2
Download original image
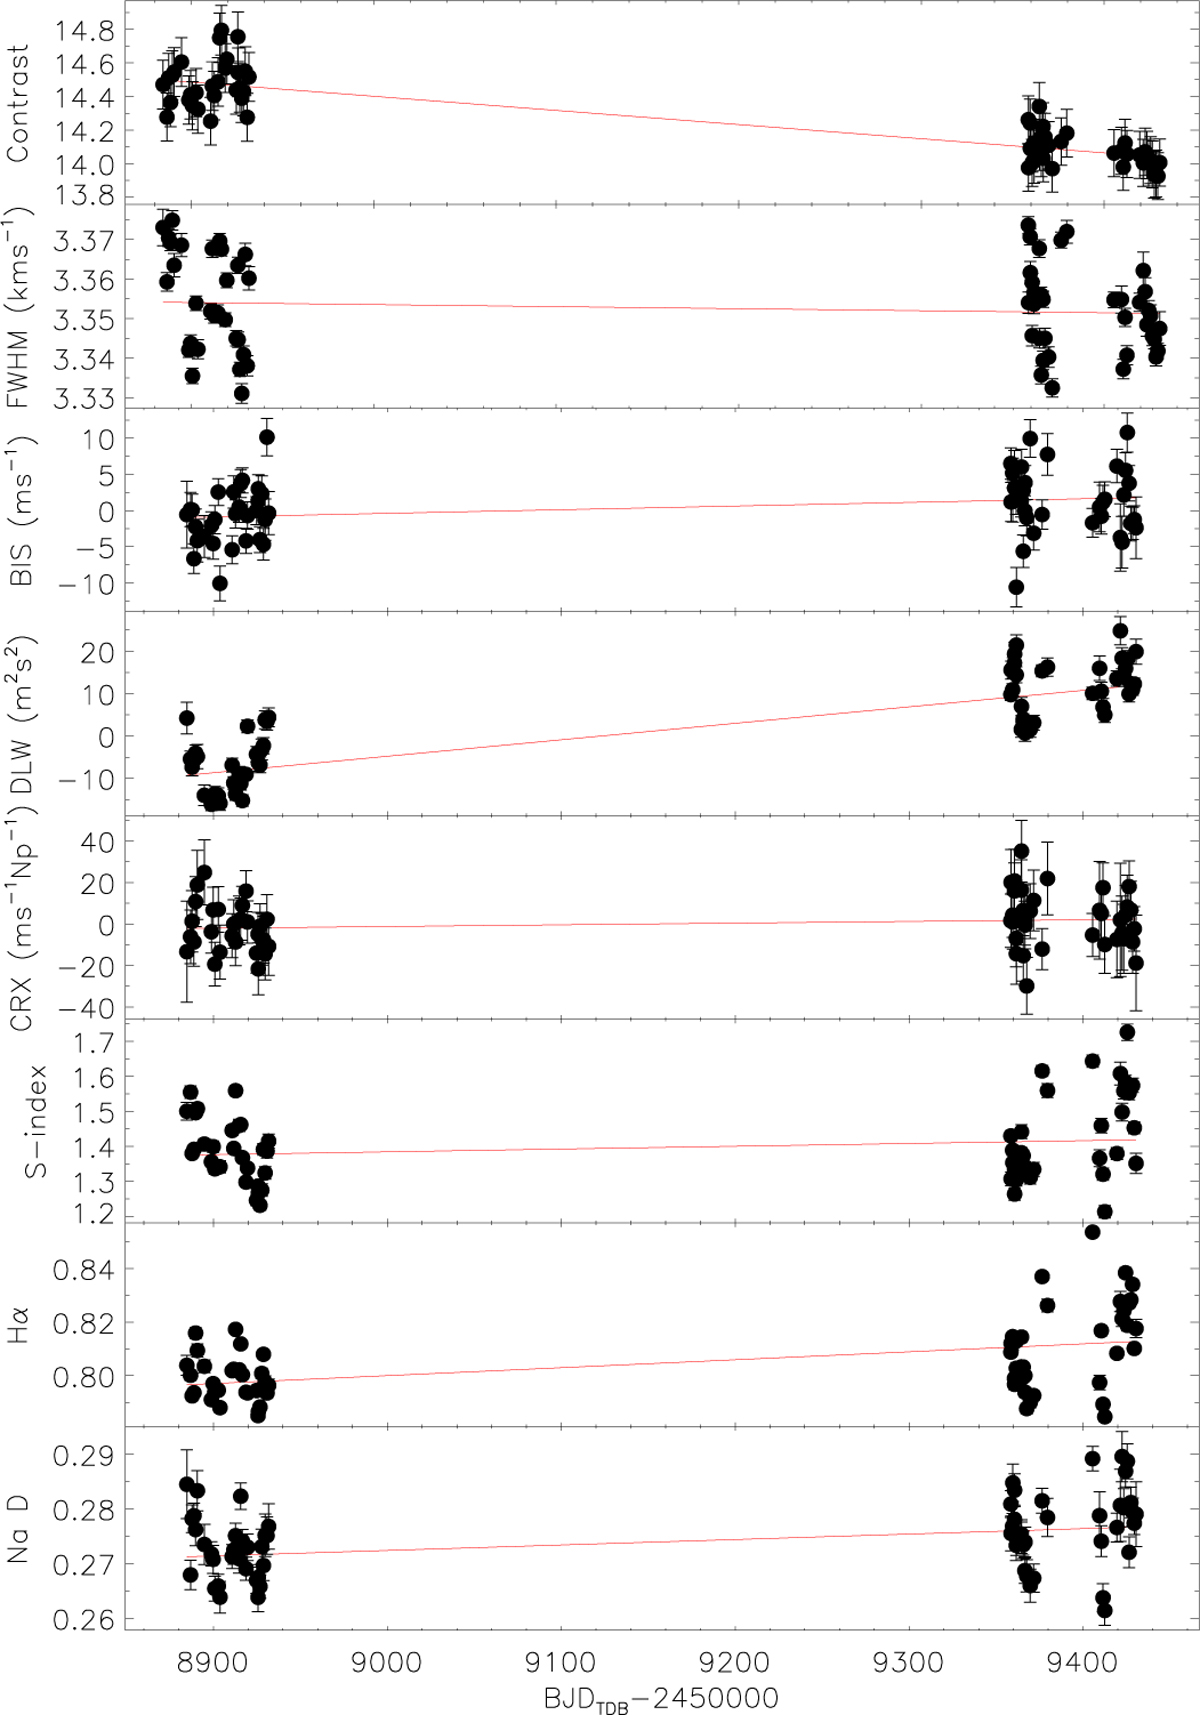
Time series of the activity indicators. The complete RV data set has been used. The thick red lines mark the best-fitting line fit. We note the change in the activity level between the two seasons significantly detected in the contrast (first panel), the DLW (fourth panel), and the Ha index (seventh panel). The time is given as BJDTDB = Barycentric Julian Dates in Barycentric Dynamical Time − 2 450 000.
Current usage metrics show cumulative count of Article Views (full-text article views including HTML views, PDF and ePub downloads, according to the available data) and Abstracts Views on Vision4Press platform.
Data correspond to usage on the plateform after 2015. The current usage metrics is available 48-96 hours after online publication and is updated daily on week days.
Initial download of the metrics may take a while.