Fig. B.1.
Download original image
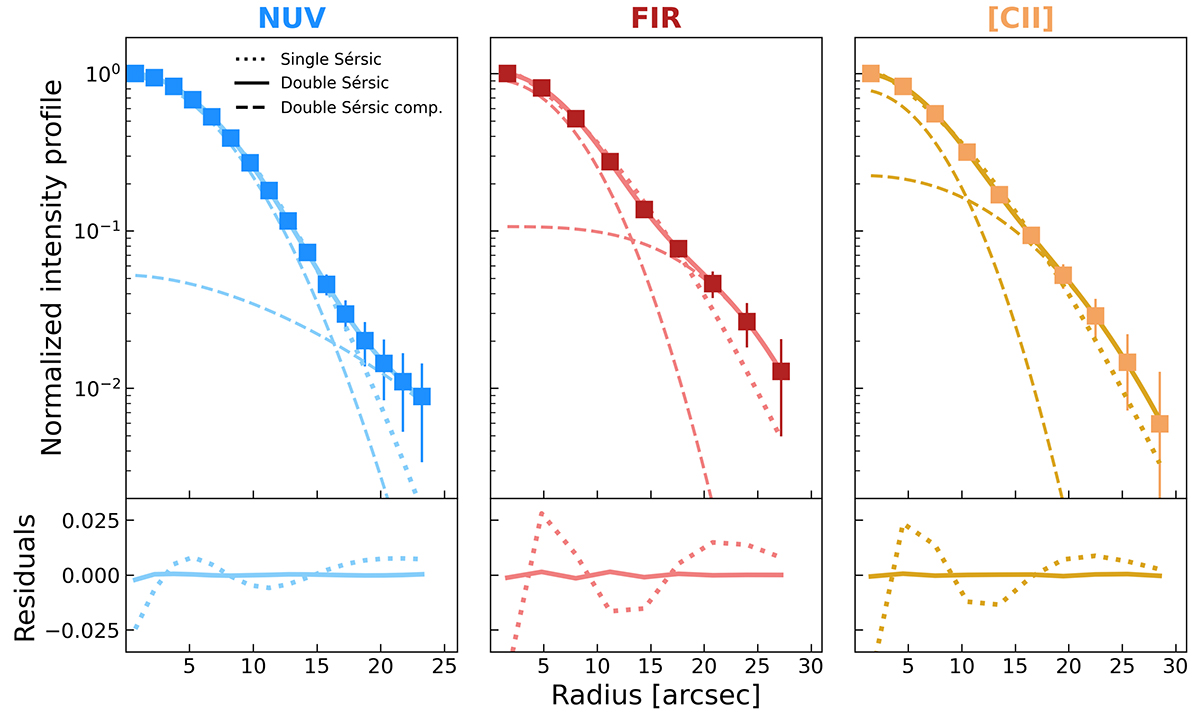
Stacked profiles for the [CII], NUV, and FIR emission. Top panels: Normalized intensity profiles for the convolved NUV continuum, FIR dust emission, and [CII] line (from left to right) represented by the light blue, red, and orange squares, respectively. In each panel the best fit is shown as a single (dotted line) and a double (solid line) Sérsic function. In this latter case, the central and extended components of the fit with dashed lines are also shown. Bottom panels: Residuals of the fit to the corresponding profile with the single (dotted line) and double (solid line) Sérsic function.
Current usage metrics show cumulative count of Article Views (full-text article views including HTML views, PDF and ePub downloads, according to the available data) and Abstracts Views on Vision4Press platform.
Data correspond to usage on the plateform after 2015. The current usage metrics is available 48-96 hours after online publication and is updated daily on week days.
Initial download of the metrics may take a while.