Fig. 1.
Download original image
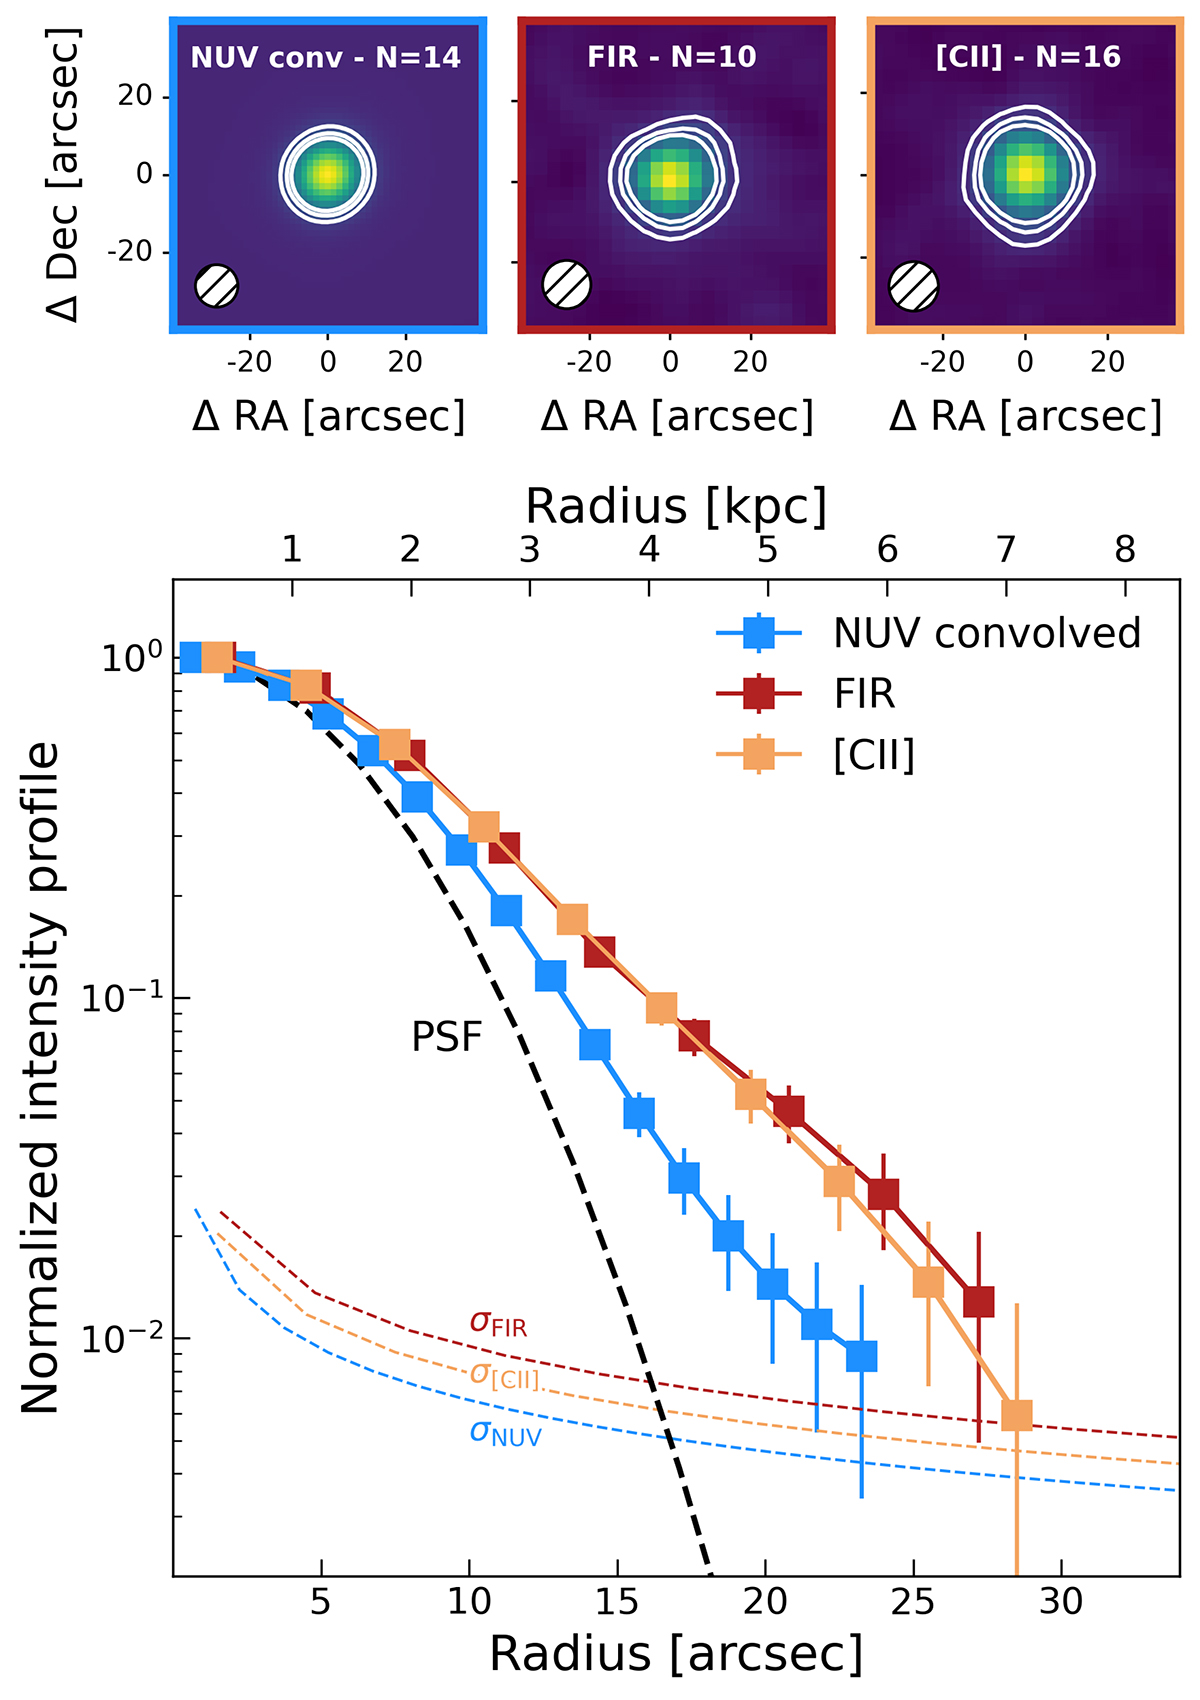
Stacked images and profiles of the [CII], FIR, and NUV emission. Top panels: Stacked intensity maps of the convolved NUV emission, FIR continuum, and [CII] line (from left to right). In each map the number of stacked sources, and the PSF beam are shown. The contours show the 3, 5, and 7σ emission. Bottom panel: Normalized intensity profiles for the [CII] line (orange), FIR dust continuum (red), and convolved NUV continuum emission (light blue). The values are obtained in concentric bins of 1 pixel width centered on the peak of the emission. The error bars are computed from the noise maps. The FIR PSF is displayed as a dashed black line. Each profile is shown up to the radius at which the uncertainties reach the corresponding Poissonian noise (colored dashed lines). The distance from the center is shown in arcseconds (bottom axis) and kiloparsec at the mean redshift of the sample (top axis).
Current usage metrics show cumulative count of Article Views (full-text article views including HTML views, PDF and ePub downloads, according to the available data) and Abstracts Views on Vision4Press platform.
Data correspond to usage on the plateform after 2015. The current usage metrics is available 48-96 hours after online publication and is updated daily on week days.
Initial download of the metrics may take a while.