Fig. 4
Download original image
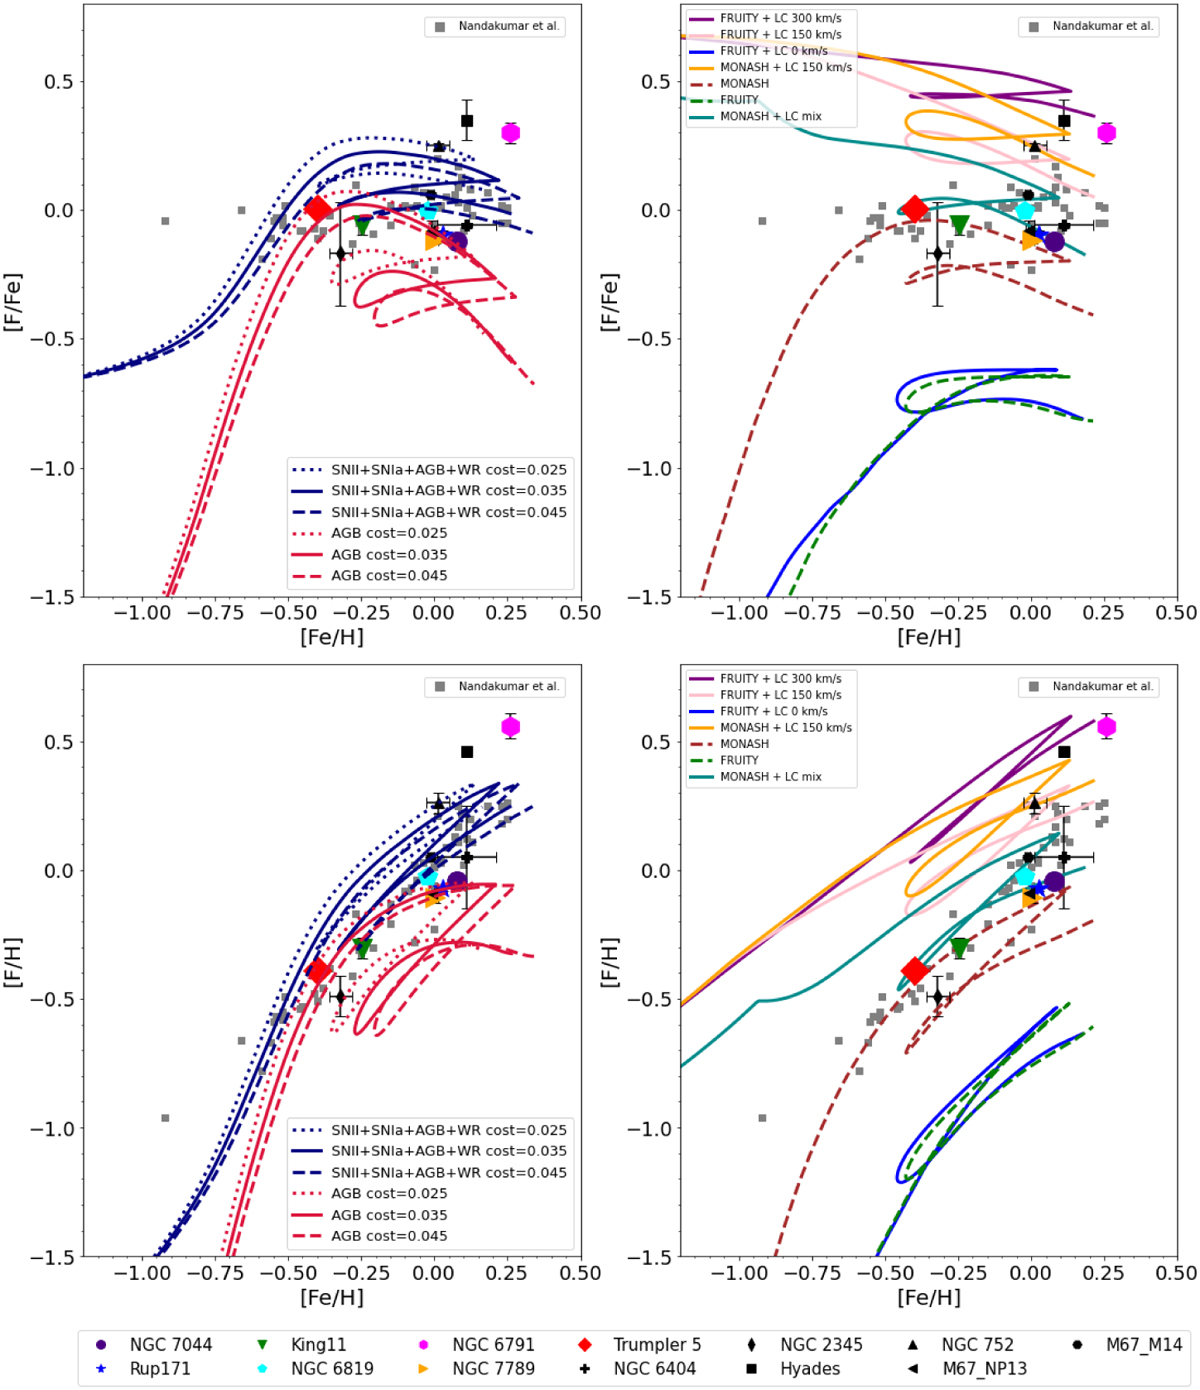
[F/Fe] and [F/H] versus [Fe/H]. The colored dots represent our sample clusters, and the lines are based on theoretical models. In the left panel, the solid lines are based on the two-infall Spitoni et al. (2019) chemical evolution models, which assume the same fluorine nucleosynthesis prescription as model F7 of Spitoni et al. (2018; see Sect. 4.3. for further details). The right panel shows the models that implement the production of F from both LIMSs and massive stars (solid lines) and the models that implement the production of F from AGB stars only (dashed lines).
Current usage metrics show cumulative count of Article Views (full-text article views including HTML views, PDF and ePub downloads, according to the available data) and Abstracts Views on Vision4Press platform.
Data correspond to usage on the plateform after 2015. The current usage metrics is available 48-96 hours after online publication and is updated daily on week days.
Initial download of the metrics may take a while.