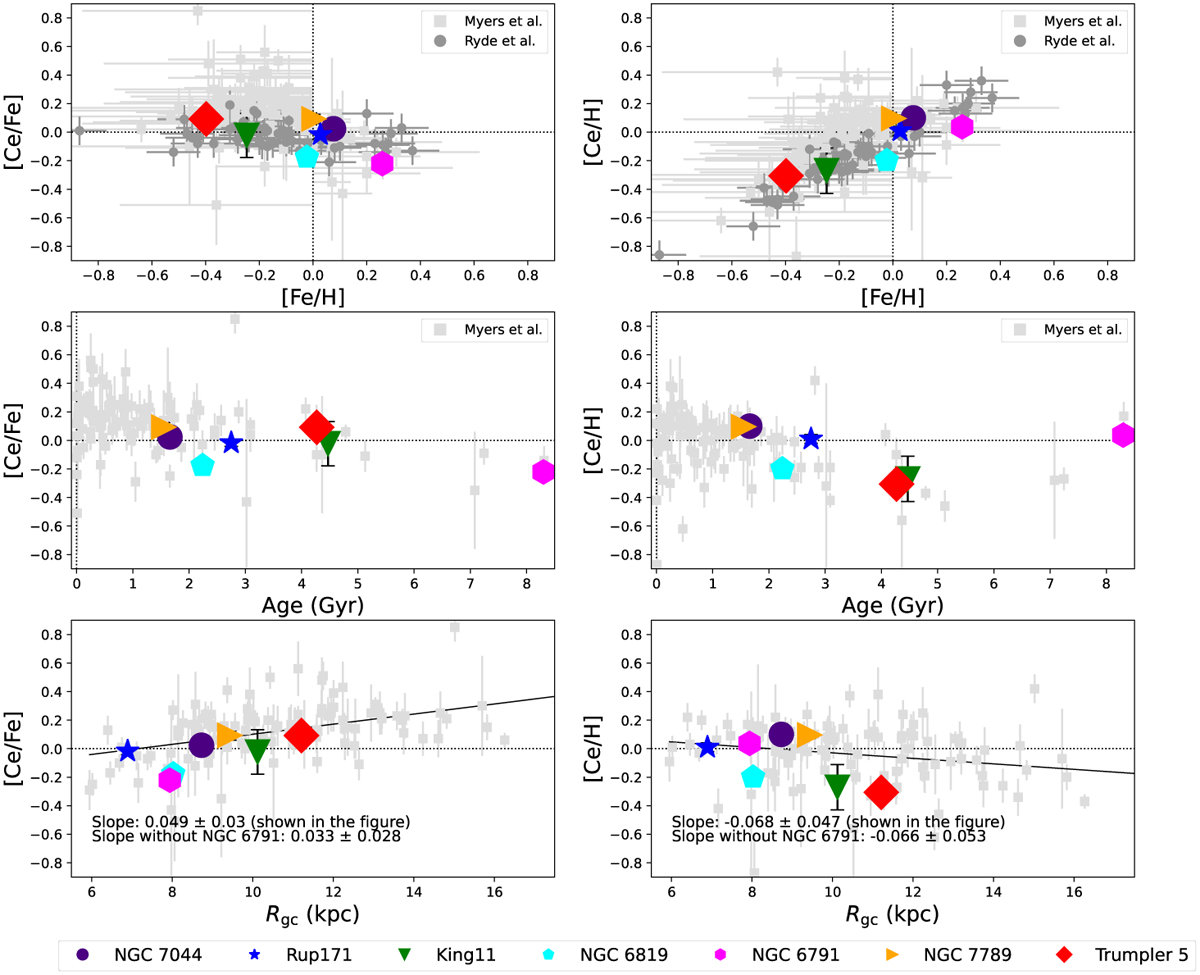
Fig. 3
Download original image
Relationship between [Ce/Fe] and [Fe/H], age, and Rgc (left) and [Ce/H] as a function of [Fe/H], age, and Rgc (right). Data for field stars taken from Ryde et al. (2020) are shown as gray dots. The clusters taken from Myers et al. (2022) are shown as light gray squares. The slopes 0.049 ± 0.03 and −0.068 ± 0.047 (shown in the figure) were obtained by incorporating the calculations of NGC 6791 into the plot.
Current usage metrics show cumulative count of Article Views (full-text article views including HTML views, PDF and ePub downloads, according to the available data) and Abstracts Views on Vision4Press platform.
Data correspond to usage on the plateform after 2015. The current usage metrics is available 48-96 hours after online publication and is updated daily on week days.
Initial download of the metrics may take a while.