Fig. 3
Download original image
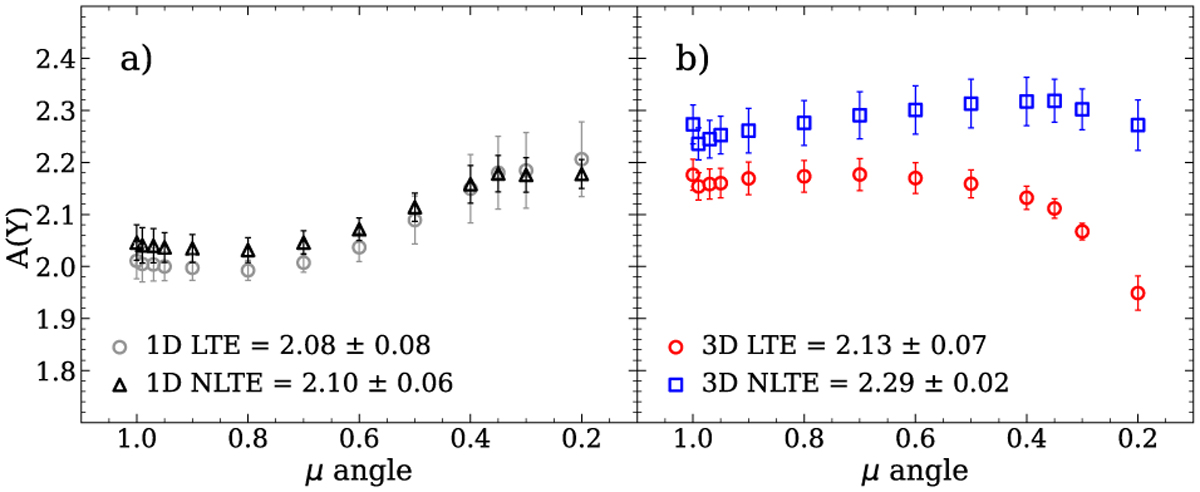
Abundances of Y determined from the IAG high-resolution solar observations taken at different viewing angles (µ) using 1D LTE, 1D NLTE, 3D LTE, and 3D NLTE models. The results obtained using 1D LTE and 1D NLTE line formation models are shown in the left panel (a). The results obtained using 3D LTE and 3D NLTE models are shown in the right panel (b). The average solar A(Y) value and its standard deviation are provided in the figure inset for each model. See the main text for further details.
Current usage metrics show cumulative count of Article Views (full-text article views including HTML views, PDF and ePub downloads, according to the available data) and Abstracts Views on Vision4Press platform.
Data correspond to usage on the plateform after 2015. The current usage metrics is available 48-96 hours after online publication and is updated daily on week days.
Initial download of the metrics may take a while.