Fig. 2.
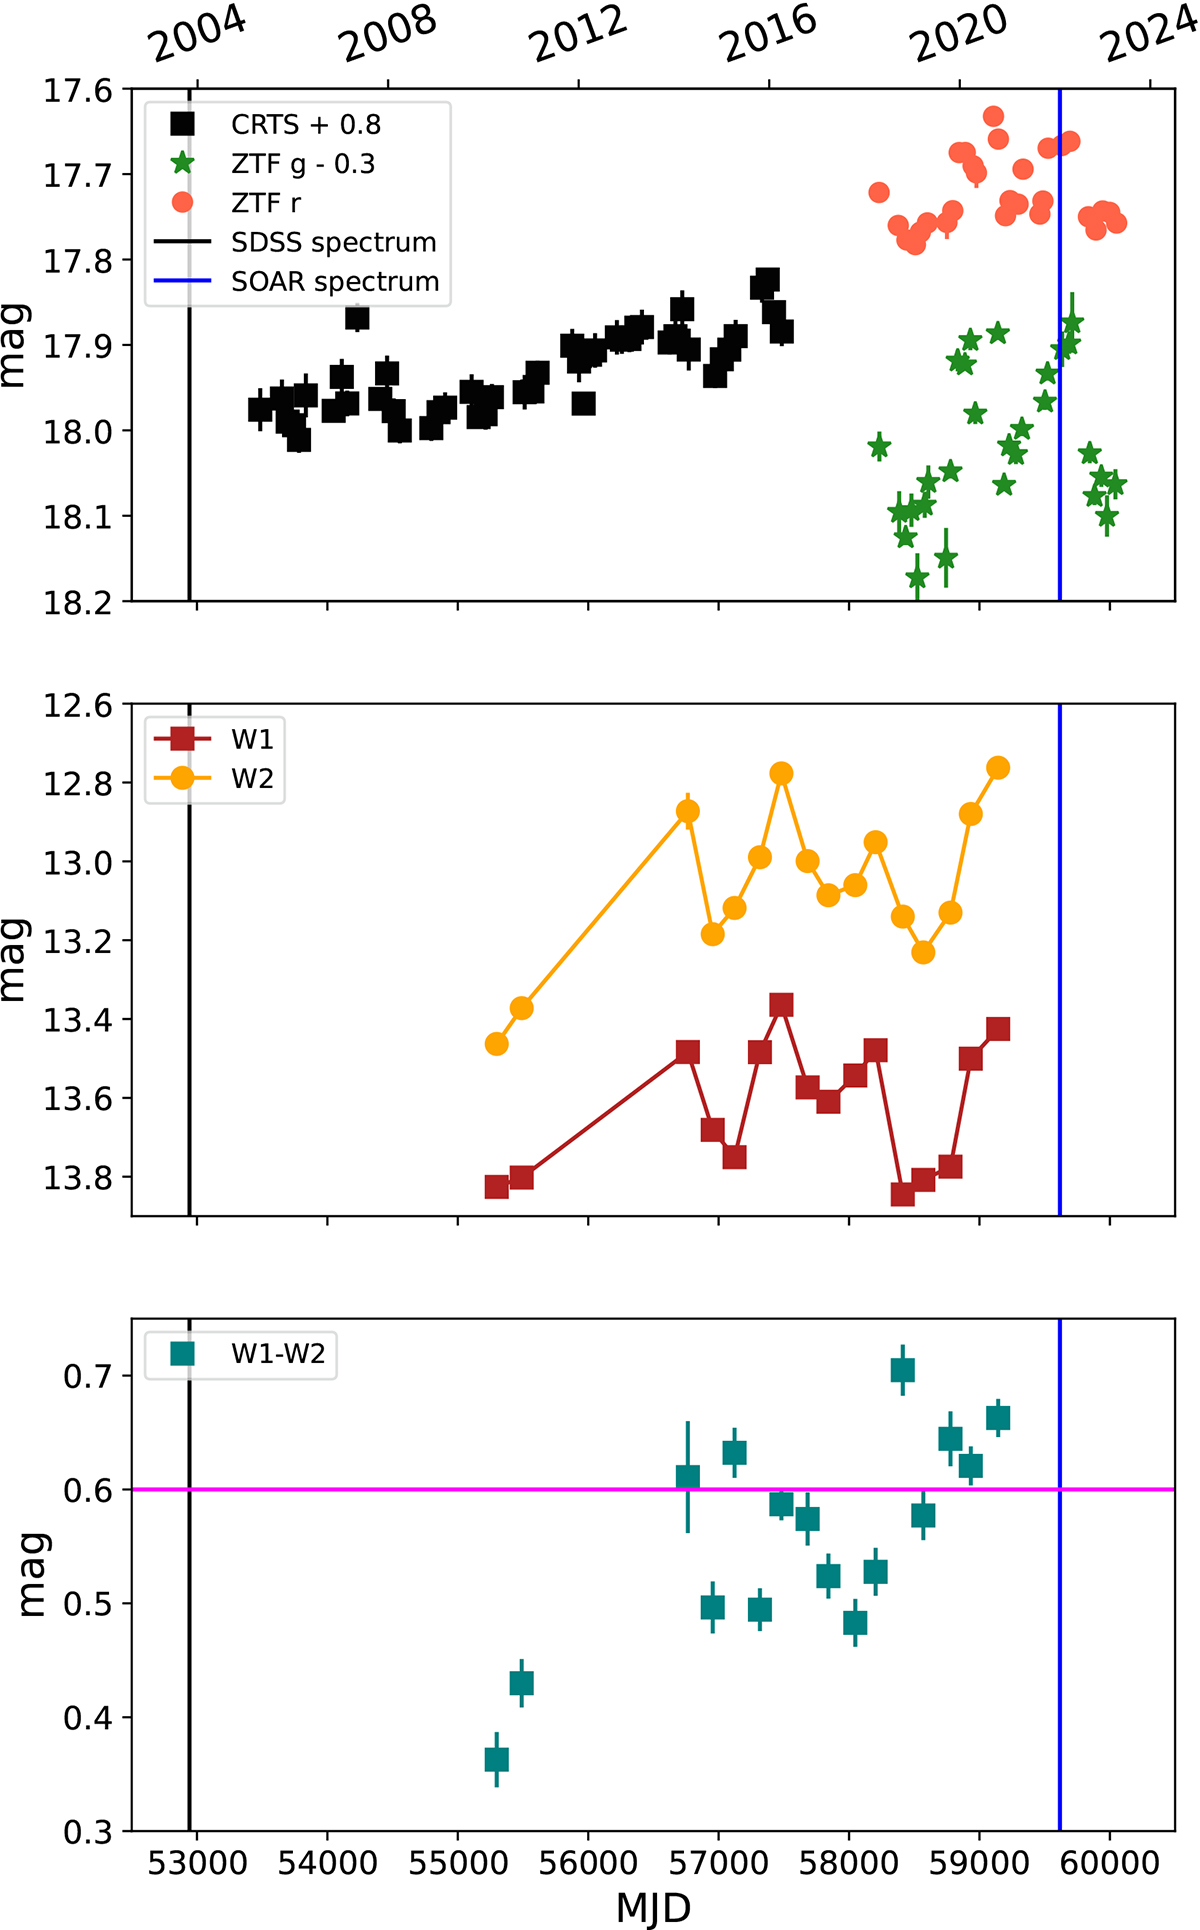
Download original image
Optical light curves of ZTF20aaglfpy, as labeled in the legend (top). The CRTS has been shifted vertically by 0.8 mag and the ZTF g-band light curve by −0.3 mag to reduce the vertical scale. Middle panel shows the MIR flux in the WISE W1 and W2 filters from the unTimely catalog. Bottom panel show the MIR color evolution, based on the magnitudes in the middle panel. The horizontal line in the bottom panel marks the AGN-like region at W1 − W2 > 0.6. In all panels, the black vertical line marks the date of the SDSS spectrum and the blue line marks the date of the SOAR confirmation spectrum.
Current usage metrics show cumulative count of Article Views (full-text article views including HTML views, PDF and ePub downloads, according to the available data) and Abstracts Views on Vision4Press platform.
Data correspond to usage on the plateform after 2015. The current usage metrics is available 48-96 hours after online publication and is updated daily on week days.
Initial download of the metrics may take a while.