Fig. 1.
Download original image
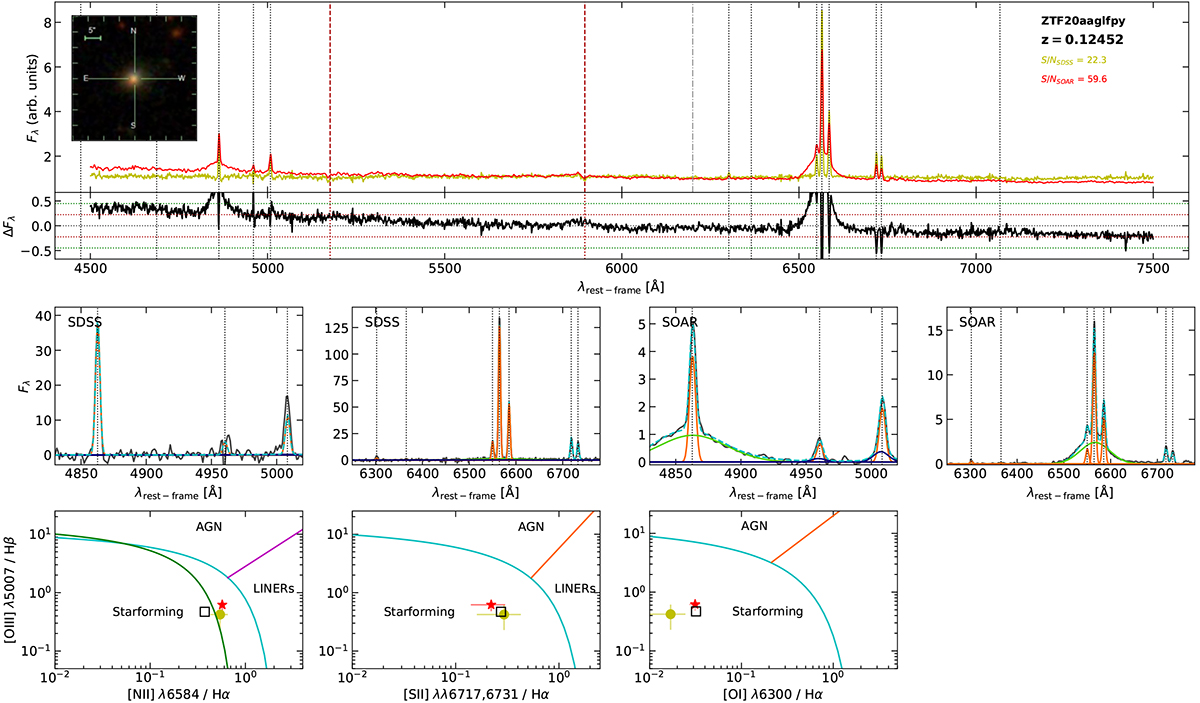
Original SDSS spectrum (yellow) and new SOAR spectrum (red) of ZTF20aaglfpy, shown at the top. Both spectra are normalized at 6200 Å (vertical dot-dashed gray line). Vertical dotted lines indicate the main emission lines, while red dashed lines correspond to the Mg and Na absorption lines. Inset panel shows the galaxy field of a 40″ × 40″ region around the galaxy, taken from the SDSS database. The residuals in this panel highlight the difference spectrum, with a blue slope and broad Balmer lines. Horizontal lines indicate the zero-level (black line), and the rms limits at 1σ (red line) and 2σ (green line), respectively. Middle panels: regions around Hβ and Hα for the old (left) and new (right) spectra, together with the fitted model, narrow emission lines in orange, broad emission lines in green, and blueshifted components for O[III] (blue). Bottom panels show three BPT diagnostics diagrams for different combinations of narrow emission line fluxes. The green circles represent our fits to the archival SDSS spectrum and red stars to the new SOAR spectrum. Black squares are the values derived for the archival SDSS spectrum presented in the RCSED2 catalog.
Current usage metrics show cumulative count of Article Views (full-text article views including HTML views, PDF and ePub downloads, according to the available data) and Abstracts Views on Vision4Press platform.
Data correspond to usage on the plateform after 2015. The current usage metrics is available 48-96 hours after online publication and is updated daily on week days.
Initial download of the metrics may take a while.