Open Access
Fig. 6
Download original image
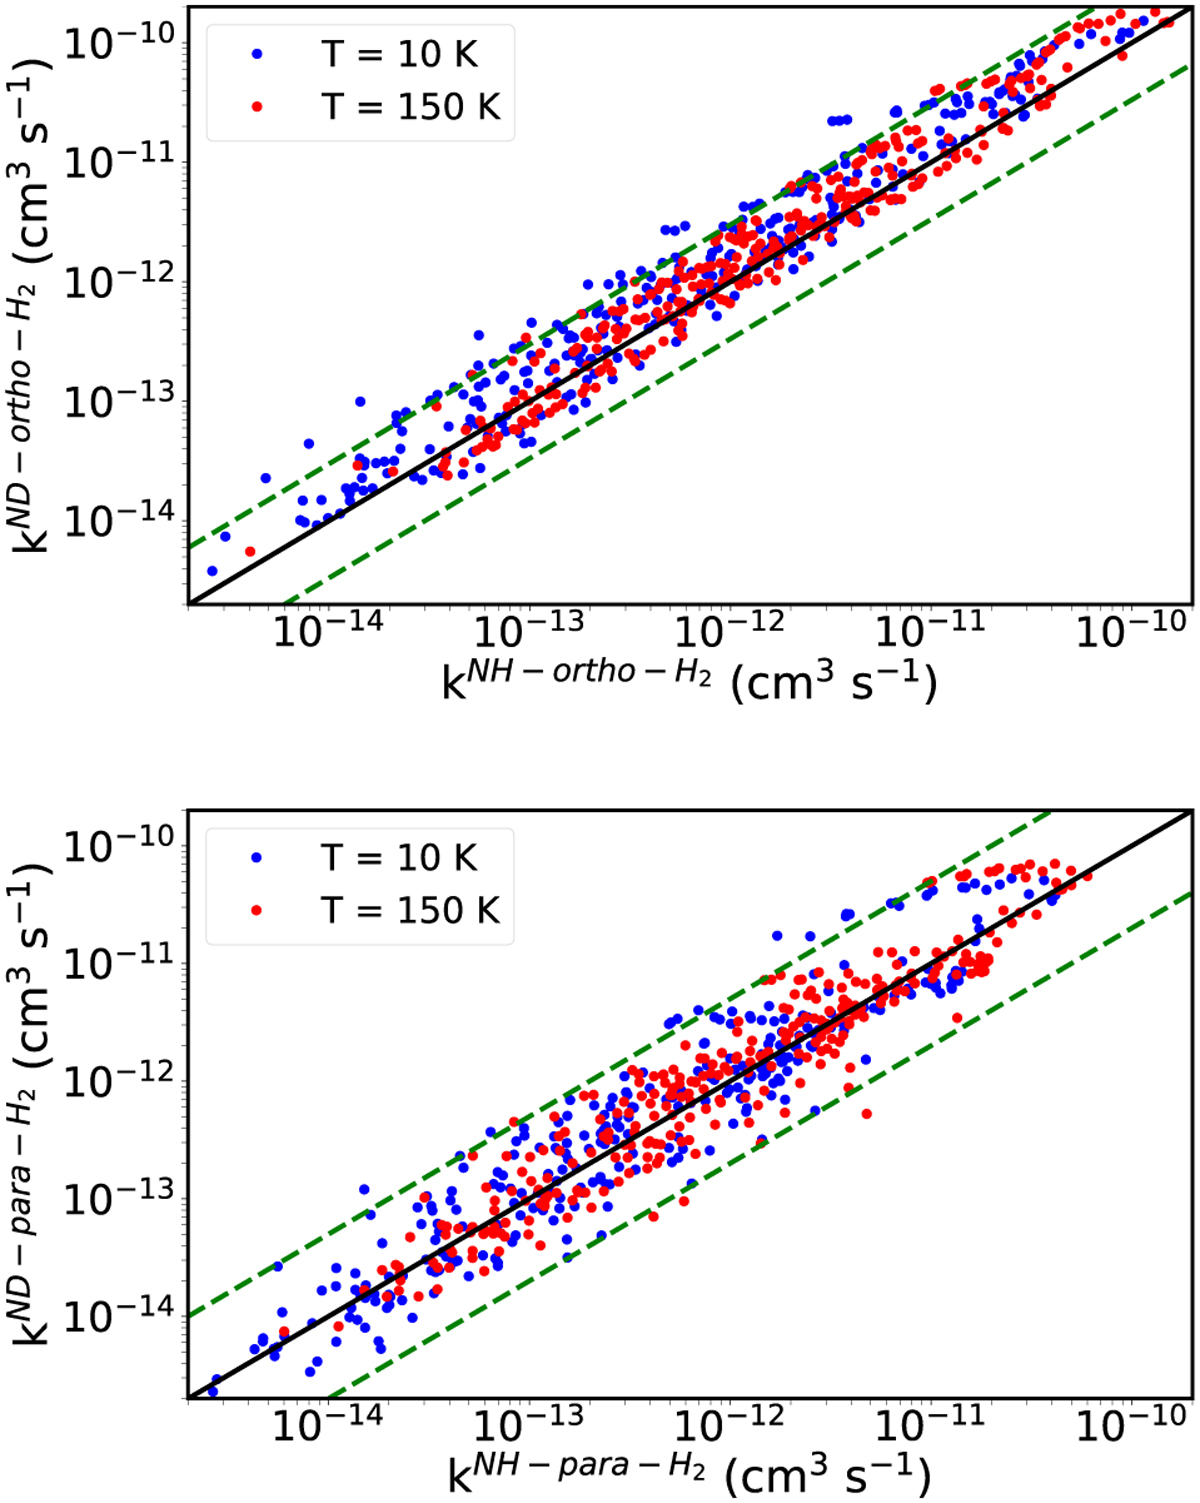
Systematic comparison between NH and ND rate coefficients at 10 and 150 K. The top panel shows ortho-H2 collisions, where the green dashed lines quantify deviations by a factor of 3. The bottom panel is related to para-H2 collisions and the green dashed lines present differences of a factor of 5.
Current usage metrics show cumulative count of Article Views (full-text article views including HTML views, PDF and ePub downloads, according to the available data) and Abstracts Views on Vision4Press platform.
Data correspond to usage on the plateform after 2015. The current usage metrics is available 48-96 hours after online publication and is updated daily on week days.
Initial download of the metrics may take a while.