Fig. 13
Download original image
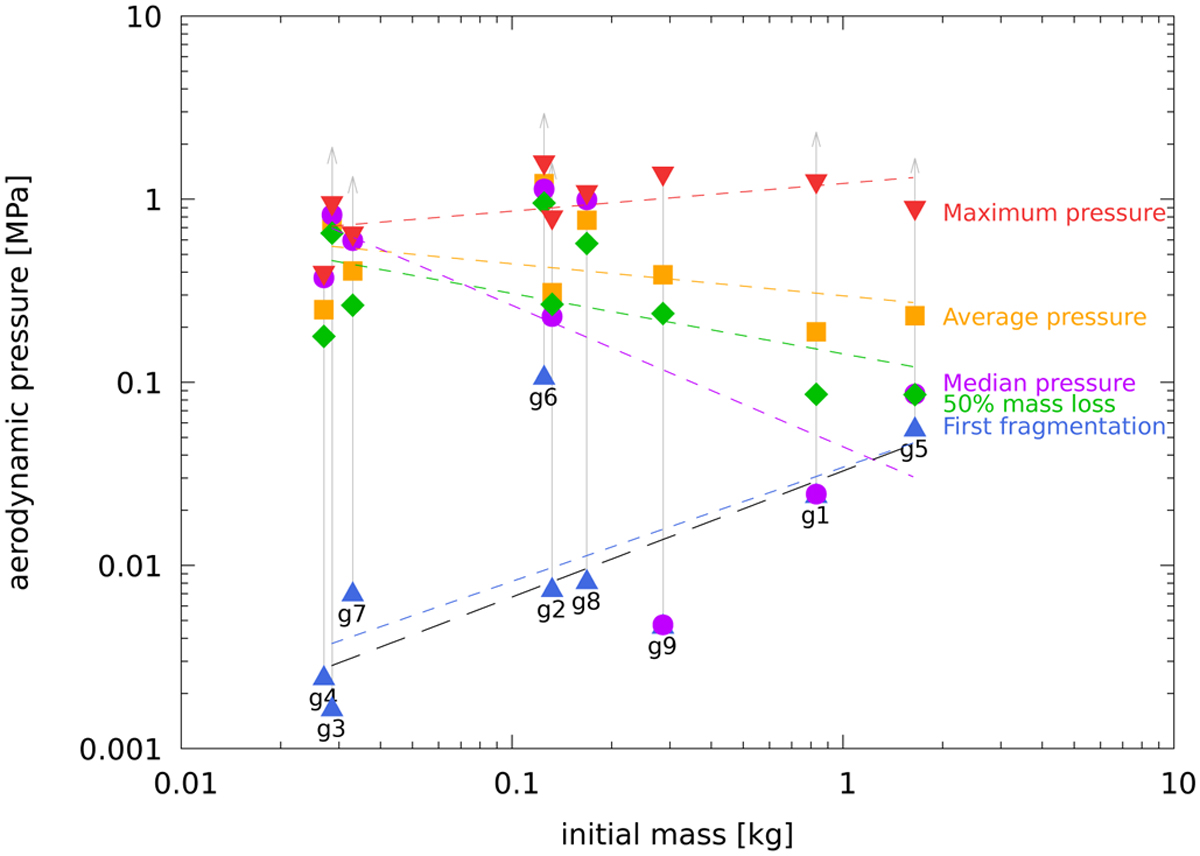
Statistical values of aerodynamic pressure for the modeled Geminids as a function of their initial mass. Both axes are logarithmic. The gray arrows at the maximum pressure indicate a lower limit of the pressure. Also shown are power-law fits of the displayed characteristics. The dashed lines include all the Geminids, while the long-dashed black line at the bottom of the plot excludes Geminid 6. See Table 1 for Geminid identifications.
Current usage metrics show cumulative count of Article Views (full-text article views including HTML views, PDF and ePub downloads, according to the available data) and Abstracts Views on Vision4Press platform.
Data correspond to usage on the plateform after 2015. The current usage metrics is available 48-96 hours after online publication and is updated daily on week days.
Initial download of the metrics may take a while.