Fig. 8
Download original image
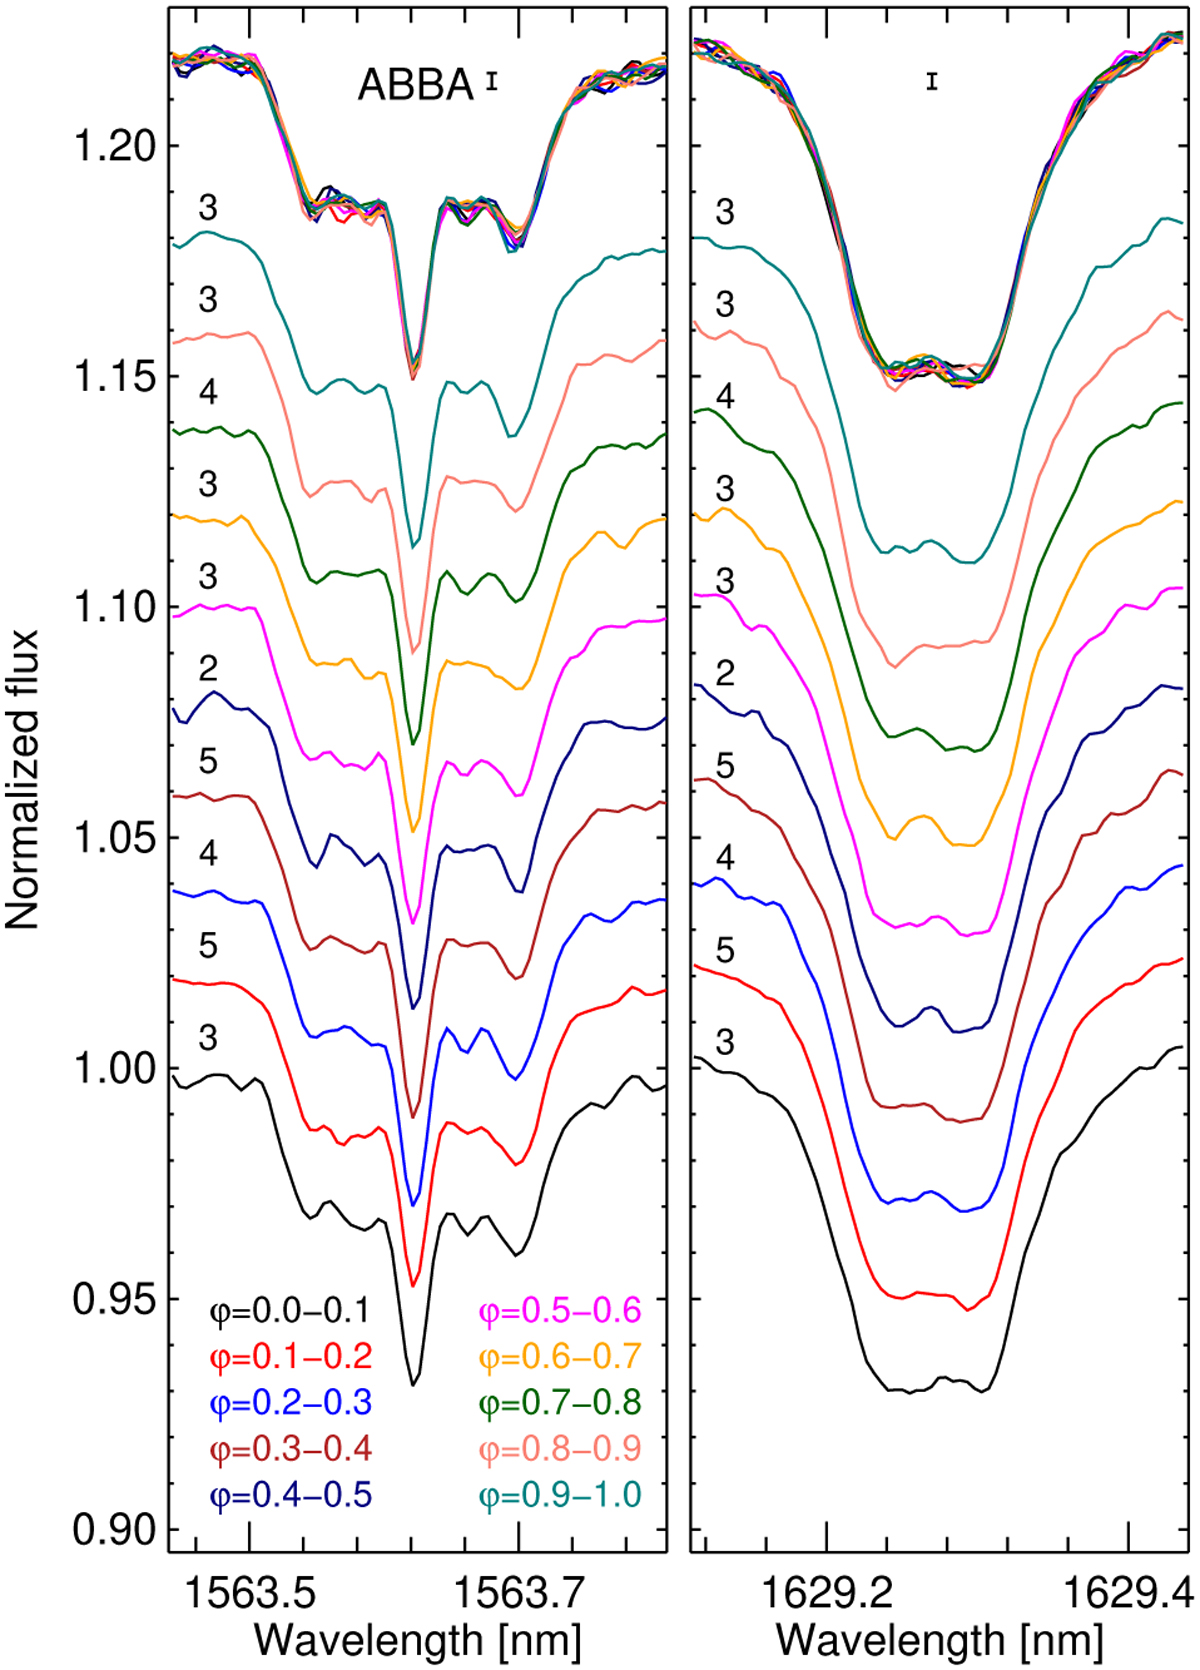
Phase-binned mean line profiles of Fe I line (left) and Ce III line (right) calculated using the ABBA sequence. For each bin, profiles are plotted with different colours and shifted upward for better visibility. The number of spectra within each bin is indicated close to each profile. At the top, we show the overplotted profiles and the corresponding error bars.
Current usage metrics show cumulative count of Article Views (full-text article views including HTML views, PDF and ePub downloads, according to the available data) and Abstracts Views on Vision4Press platform.
Data correspond to usage on the plateform after 2015. The current usage metrics is available 48-96 hours after online publication and is updated daily on week days.
Initial download of the metrics may take a while.