Open Access
Fig. 11
Download original image
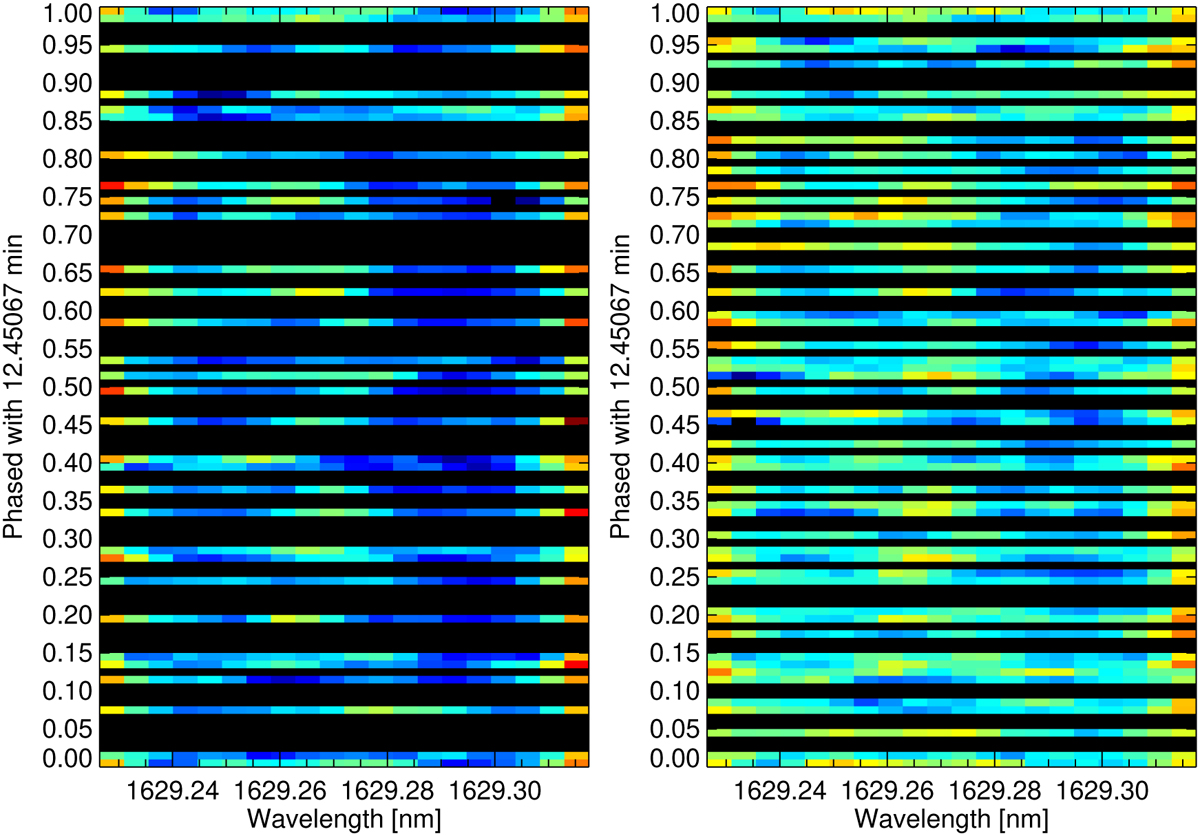
Dynamical spectrum of line core of Ce III 1629.2 nm. The bluest colour is for the deepest absorption, whereas red is for the shallower absorption. Black is used for phases not covered by the observations. Left: profiles reduced using ABBA sequence. Right: profiles reduced using AB/BA sequence.
Current usage metrics show cumulative count of Article Views (full-text article views including HTML views, PDF and ePub downloads, according to the available data) and Abstracts Views on Vision4Press platform.
Data correspond to usage on the plateform after 2015. The current usage metrics is available 48-96 hours after online publication and is updated daily on week days.
Initial download of the metrics may take a while.