Open Access
Fig. 5.
Download original image
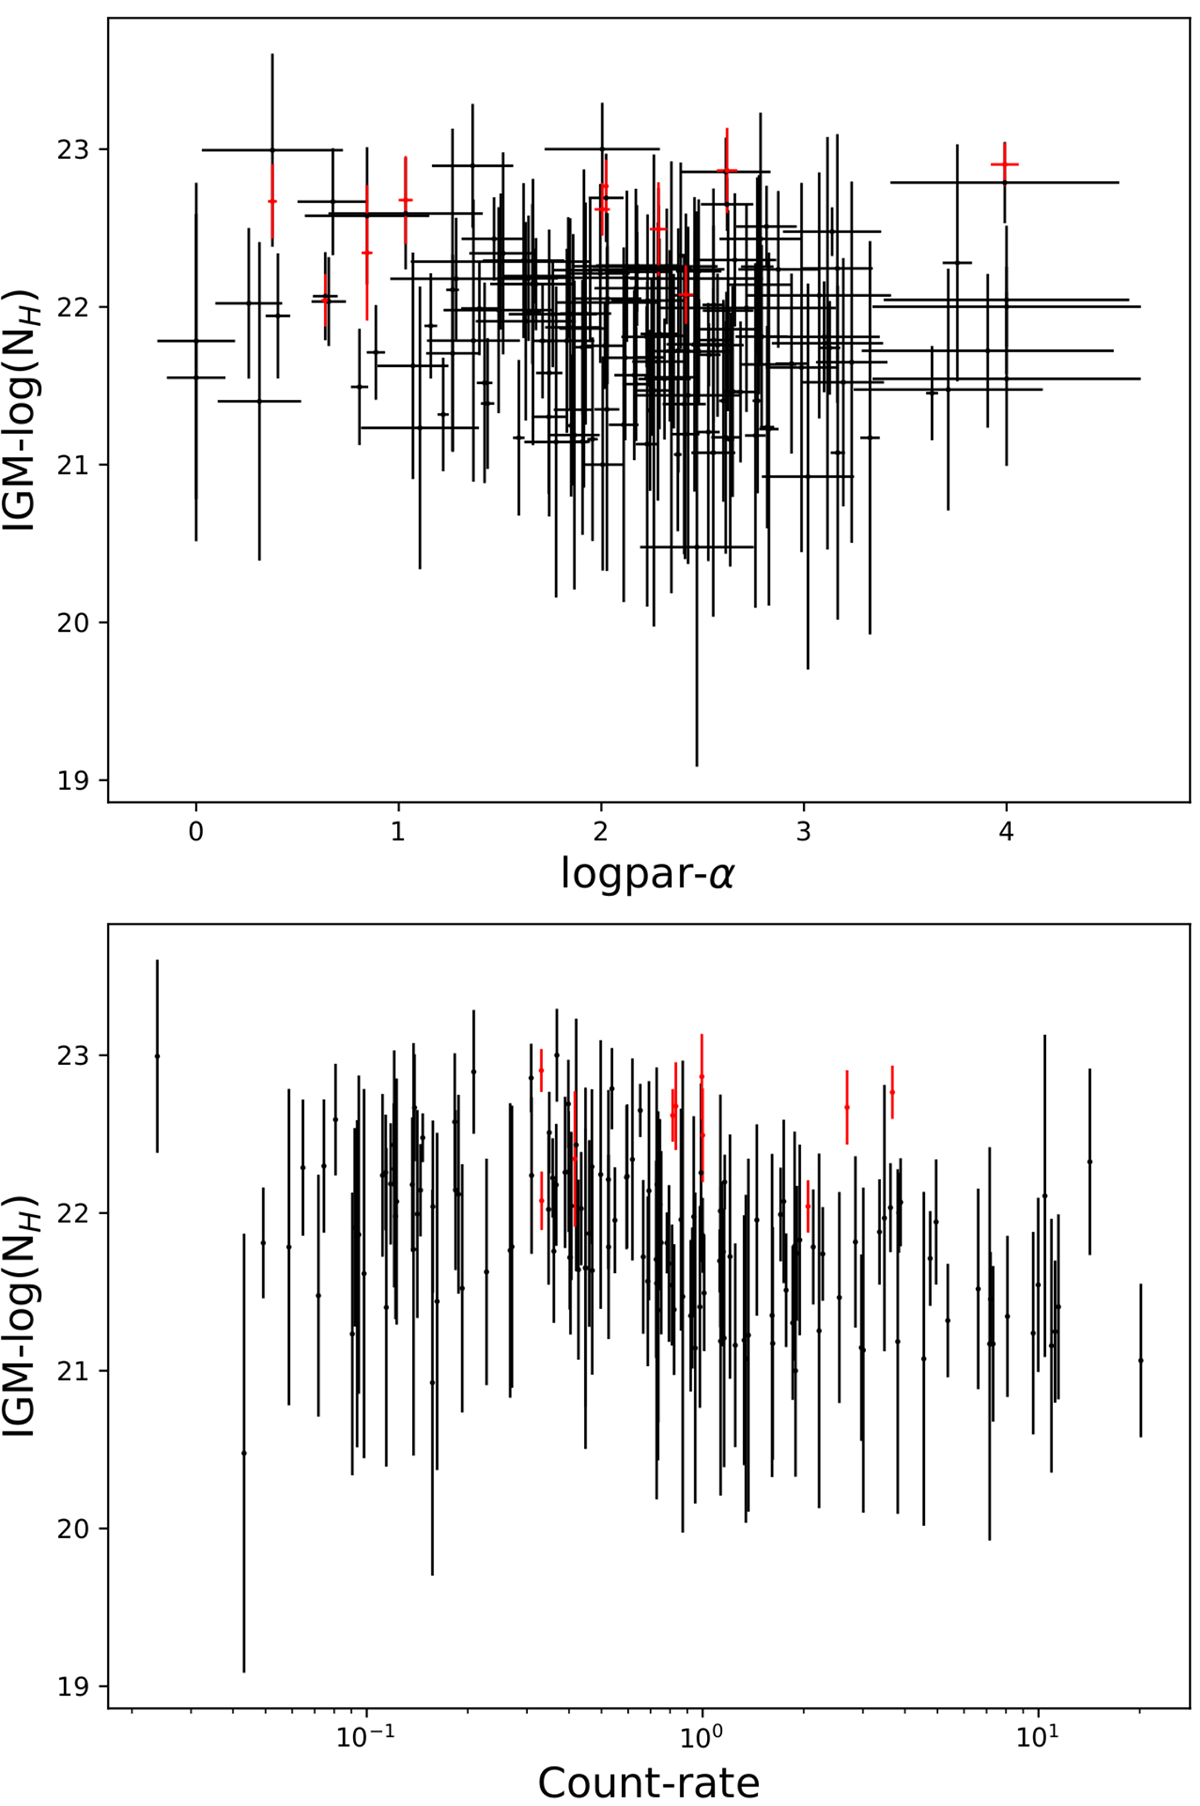
Measurements of robustness for the IGM-N(H) measurements. Top panel: distribution of IGM-N(H) as function of the logparα indices. Bottom panel: distribution of IGM-N(H) as function of the count rates. The black points show the SRG/eROSITA sample, and the red points correspond to the XMM-Newton sample.
Current usage metrics show cumulative count of Article Views (full-text article views including HTML views, PDF and ePub downloads, according to the available data) and Abstracts Views on Vision4Press platform.
Data correspond to usage on the plateform after 2015. The current usage metrics is available 48-96 hours after online publication and is updated daily on week days.
Initial download of the metrics may take a while.