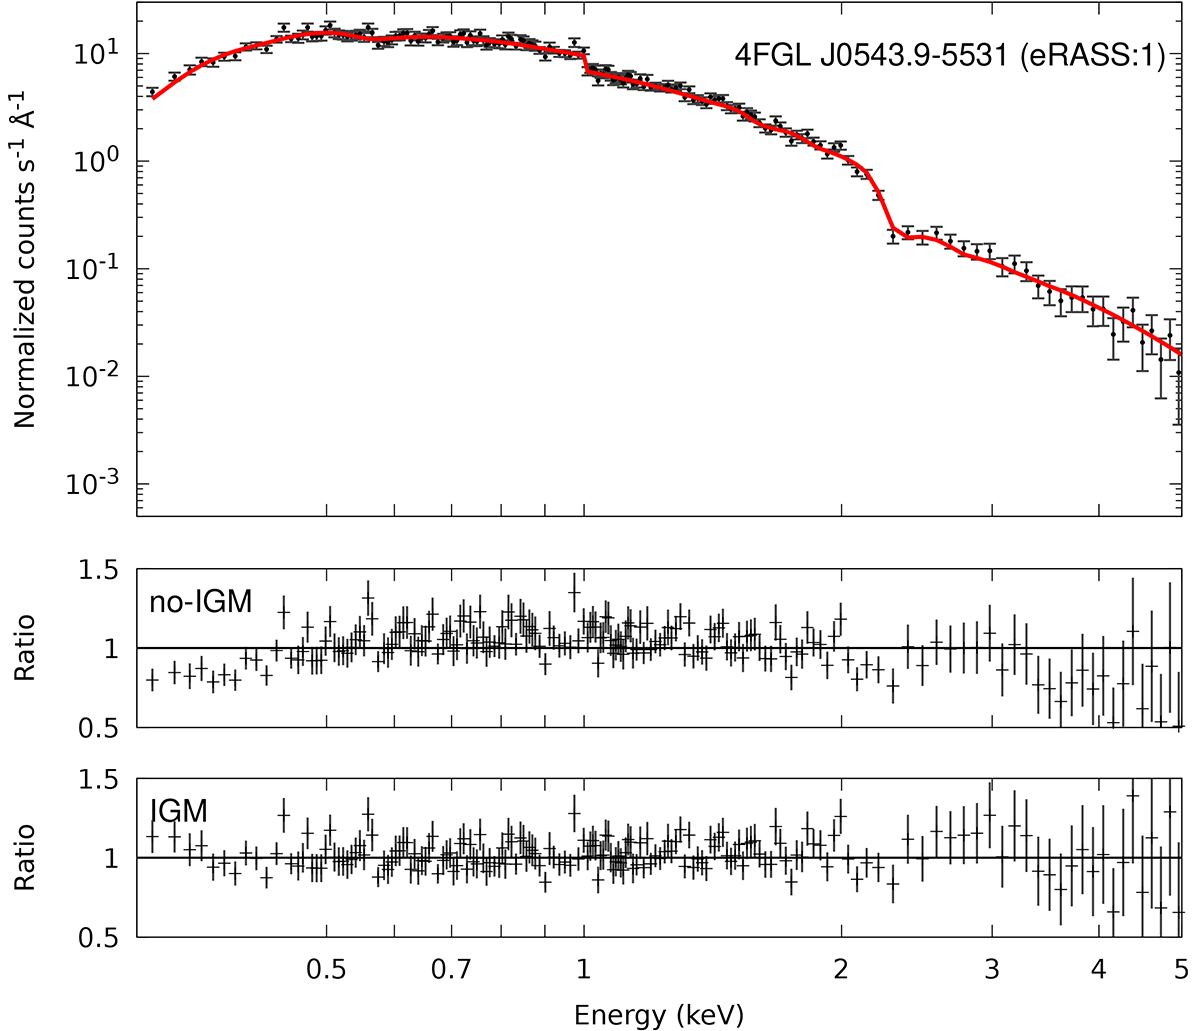
Fig. 1.
Download original image
SRG/eROSITA best-fit spectra of one of the sources included in the sample (4FGL J0543.9–5531). The black data points show the observations, and the solid red line corresponds to the best-fit model including the IGM component. The bottom panels show the data-model ratio for the models without and with the IGM component (see Sect. 3 for further details). All cameras were grouped for illustration purposes.
Current usage metrics show cumulative count of Article Views (full-text article views including HTML views, PDF and ePub downloads, according to the available data) and Abstracts Views on Vision4Press platform.
Data correspond to usage on the plateform after 2015. The current usage metrics is available 48-96 hours after online publication and is updated daily on week days.
Initial download of the metrics may take a while.