Fig. 6
Download original image
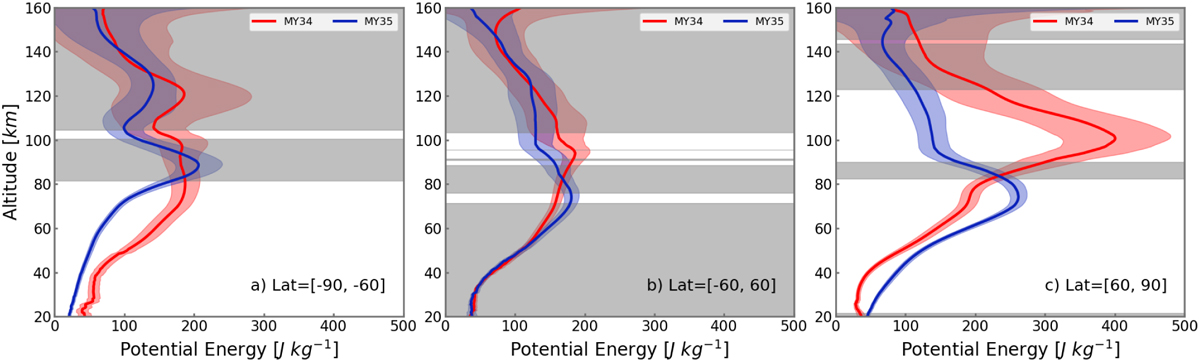
Altitude profiles of potential energy Ep averaged over three latitude intervals for the period of the GDS of MY34 (Ls=188°–250°, red profiles) and the corresponding low-dust period of MY35 (blue profiles). The colored regions around the profiles show the standard error of the mean. White regions indicate altitudes where the difference between the means was determined with statistical confidence (with a significance level of 95%, according to the Student’s t-test).
Current usage metrics show cumulative count of Article Views (full-text article views including HTML views, PDF and ePub downloads, according to the available data) and Abstracts Views on Vision4Press platform.
Data correspond to usage on the plateform after 2015. The current usage metrics is available 48-96 hours after online publication and is updated daily on week days.
Initial download of the metrics may take a while.