Fig. 4
Download original image
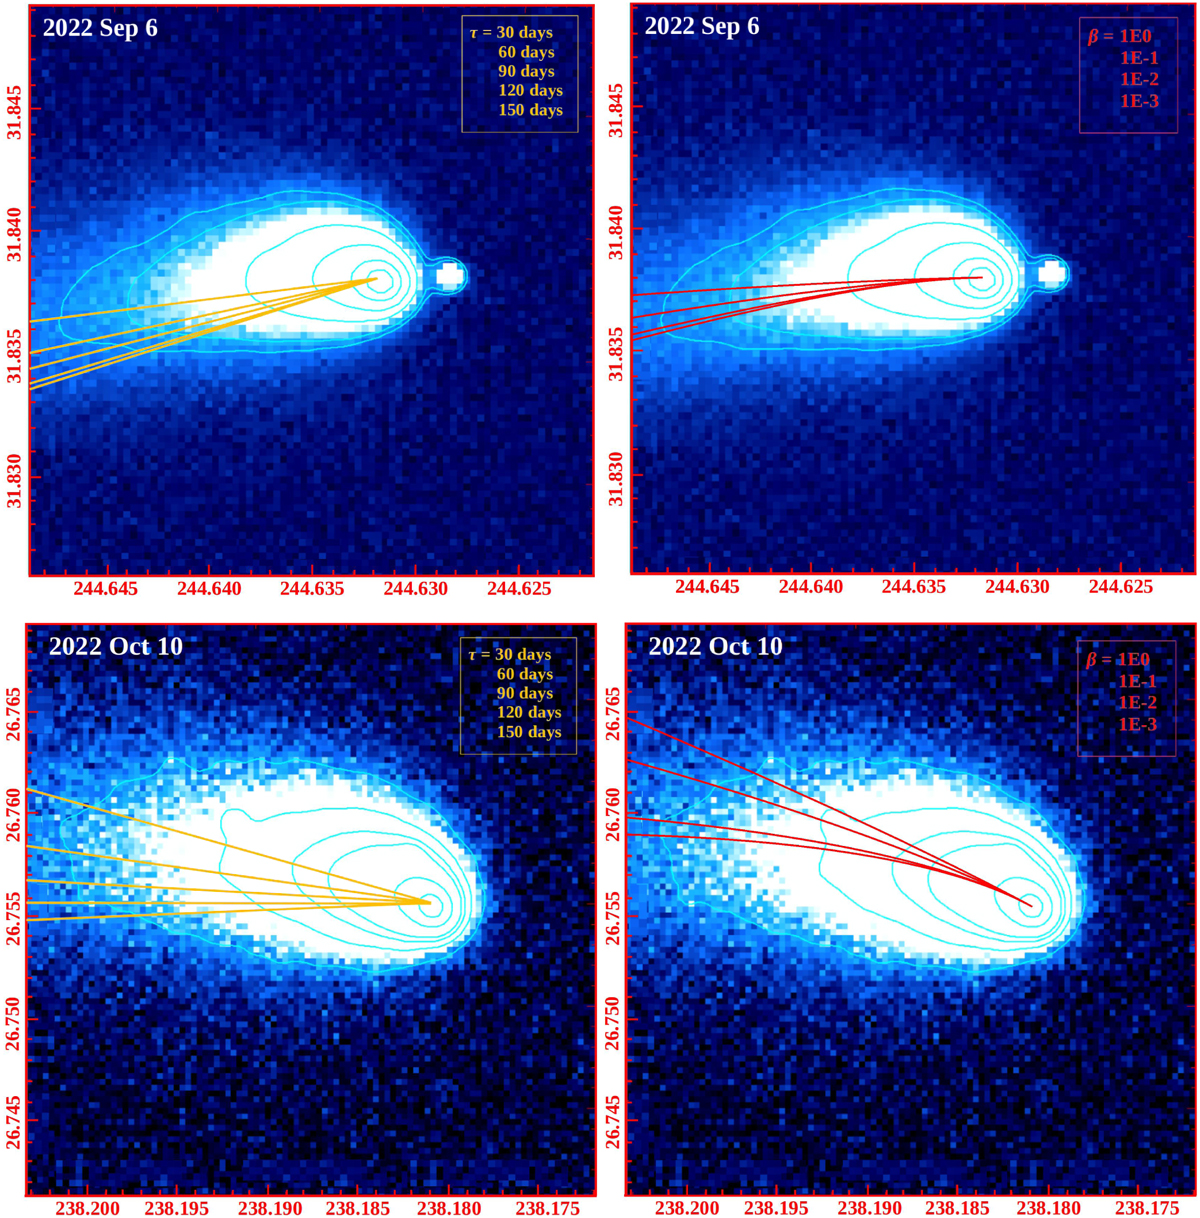
Syndyne-synchrone grids overplotted on the observation images of comet E3. The yellow lines denote the synchrones of 30, 60, 90, 120, and 150 days (from top to bottom) before the respective observation dates, and the red lines denote the sydynes of β = 1, 1 × 10−1,1 × 10−2, and 1 × 10⁻³ (from top to bottom). The images are oriented with north up (increasing DEC in degrees) and east to the left (increasing RA in degrees).
Current usage metrics show cumulative count of Article Views (full-text article views including HTML views, PDF and ePub downloads, according to the available data) and Abstracts Views on Vision4Press platform.
Data correspond to usage on the plateform after 2015. The current usage metrics is available 48-96 hours after online publication and is updated daily on week days.
Initial download of the metrics may take a while.