Open Access
Fig. 4
Download original image
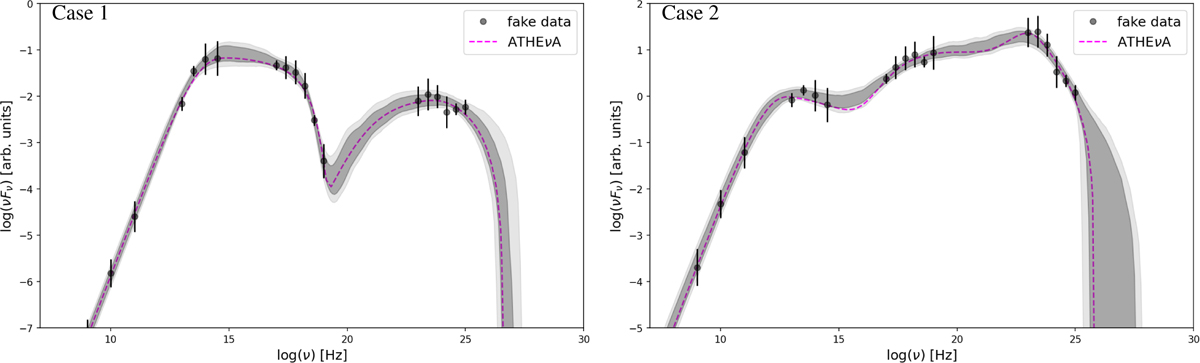
Simulated blazar SEDs fitted with the GRU NN generated model. Simulated data are shown with markers. The dashed magenta line plots the SED from the ATHEvA code. Dark- and light-shaded areas denote the range of GRU NN models with parameters from the 50% and 90% posterior distributions, respectively.
Current usage metrics show cumulative count of Article Views (full-text article views including HTML views, PDF and ePub downloads, according to the available data) and Abstracts Views on Vision4Press platform.
Data correspond to usage on the plateform after 2015. The current usage metrics is available 48-96 hours after online publication and is updated daily on week days.
Initial download of the metrics may take a while.