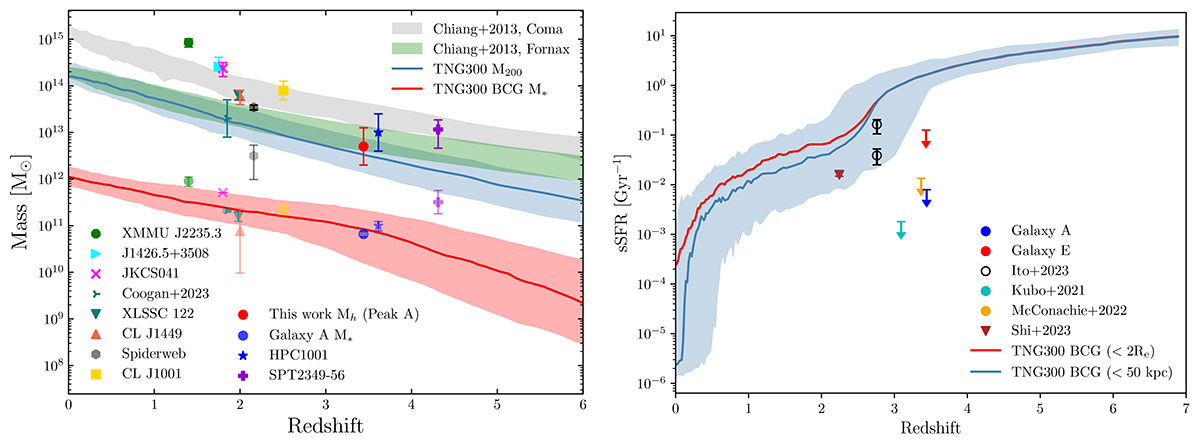
Fig. 3.
Download original image
Comparison with simulations. Left: Mass vs. redshift for literature proto-clusters and TNG300 simulations. The gray and blue shaded areas show the simulated halo mass evolution of proto-clusters in the Chiang et al. (2013) and TNG300 simulations (Montenegro-Taborda et al. 2023), repectively. The red shaded area marks the stellar mass of BCGs in TNG300 (Montenegro-Taborda et al. 2023). The halo mass of peak A and the stellar mass of Galaxy A are consistent with the predictions from the models, suggesting a massive descendant with a halo mass of more than 1014 M⊙ at z = 0. Right: sSFR vs. redshift for BCGs. The sSFRs of BCGs in TNG300 simulations (Montenegro-Taborda et al. 2023) are shown as blue and red curves, overlaying with the observed sSFRs of massive quiescent members in z > 2 proto-clusters. The blue shaded regions indicate the 16th to 84th percentile range of the r < 50 kpc sSFR measurements in TNG300.
Current usage metrics show cumulative count of Article Views (full-text article views including HTML views, PDF and ePub downloads, according to the available data) and Abstracts Views on Vision4Press platform.
Data correspond to usage on the plateform after 2015. The current usage metrics is available 48-96 hours after online publication and is updated daily on week days.
Initial download of the metrics may take a while.