Open Access
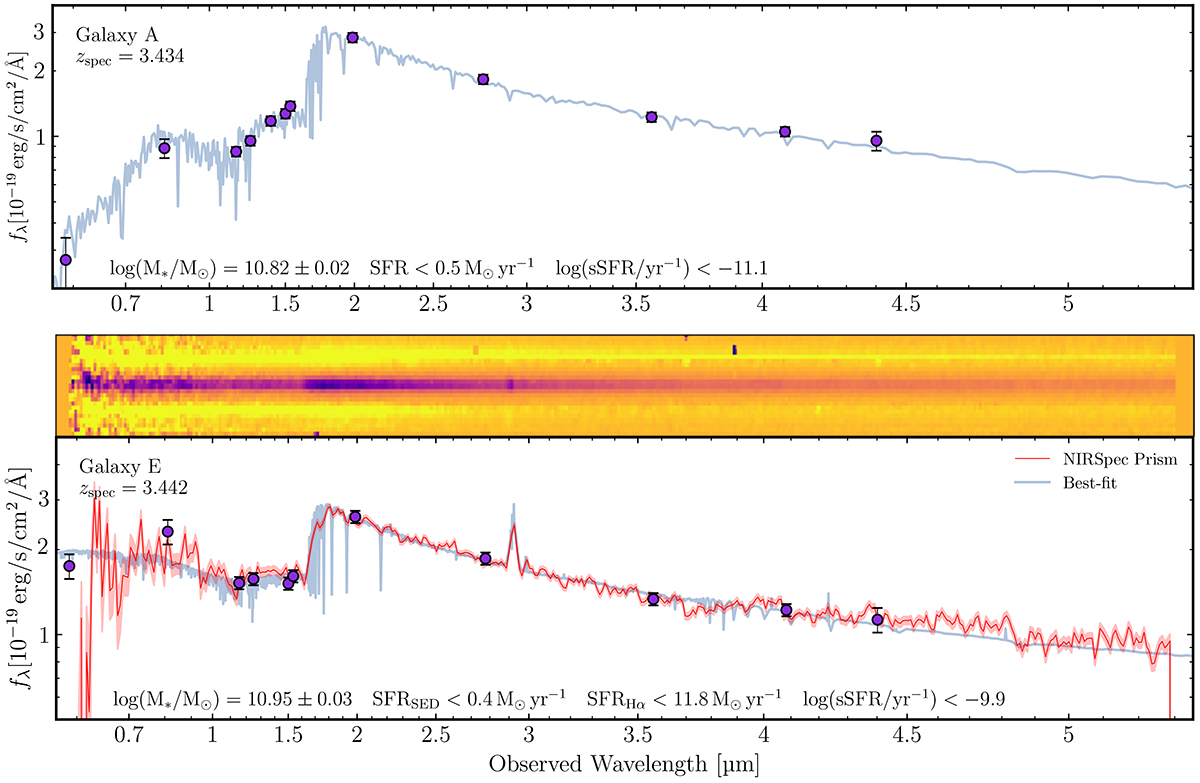
Fig. 2.
Download original image
SED and spectra of Galaxy A and E. The blue curves show the best fit of the Bagpipes fitting. For Galaxy E, The NIRSpec Prism 2D spectrum is overplotted on the 1D spectrum. The 1D spectrum is shown in red with the uncertainty marked in shade.
Current usage metrics show cumulative count of Article Views (full-text article views including HTML views, PDF and ePub downloads, according to the available data) and Abstracts Views on Vision4Press platform.
Data correspond to usage on the plateform after 2015. The current usage metrics is available 48-96 hours after online publication and is updated daily on week days.
Initial download of the metrics may take a while.