Open Access
Fig. 7.
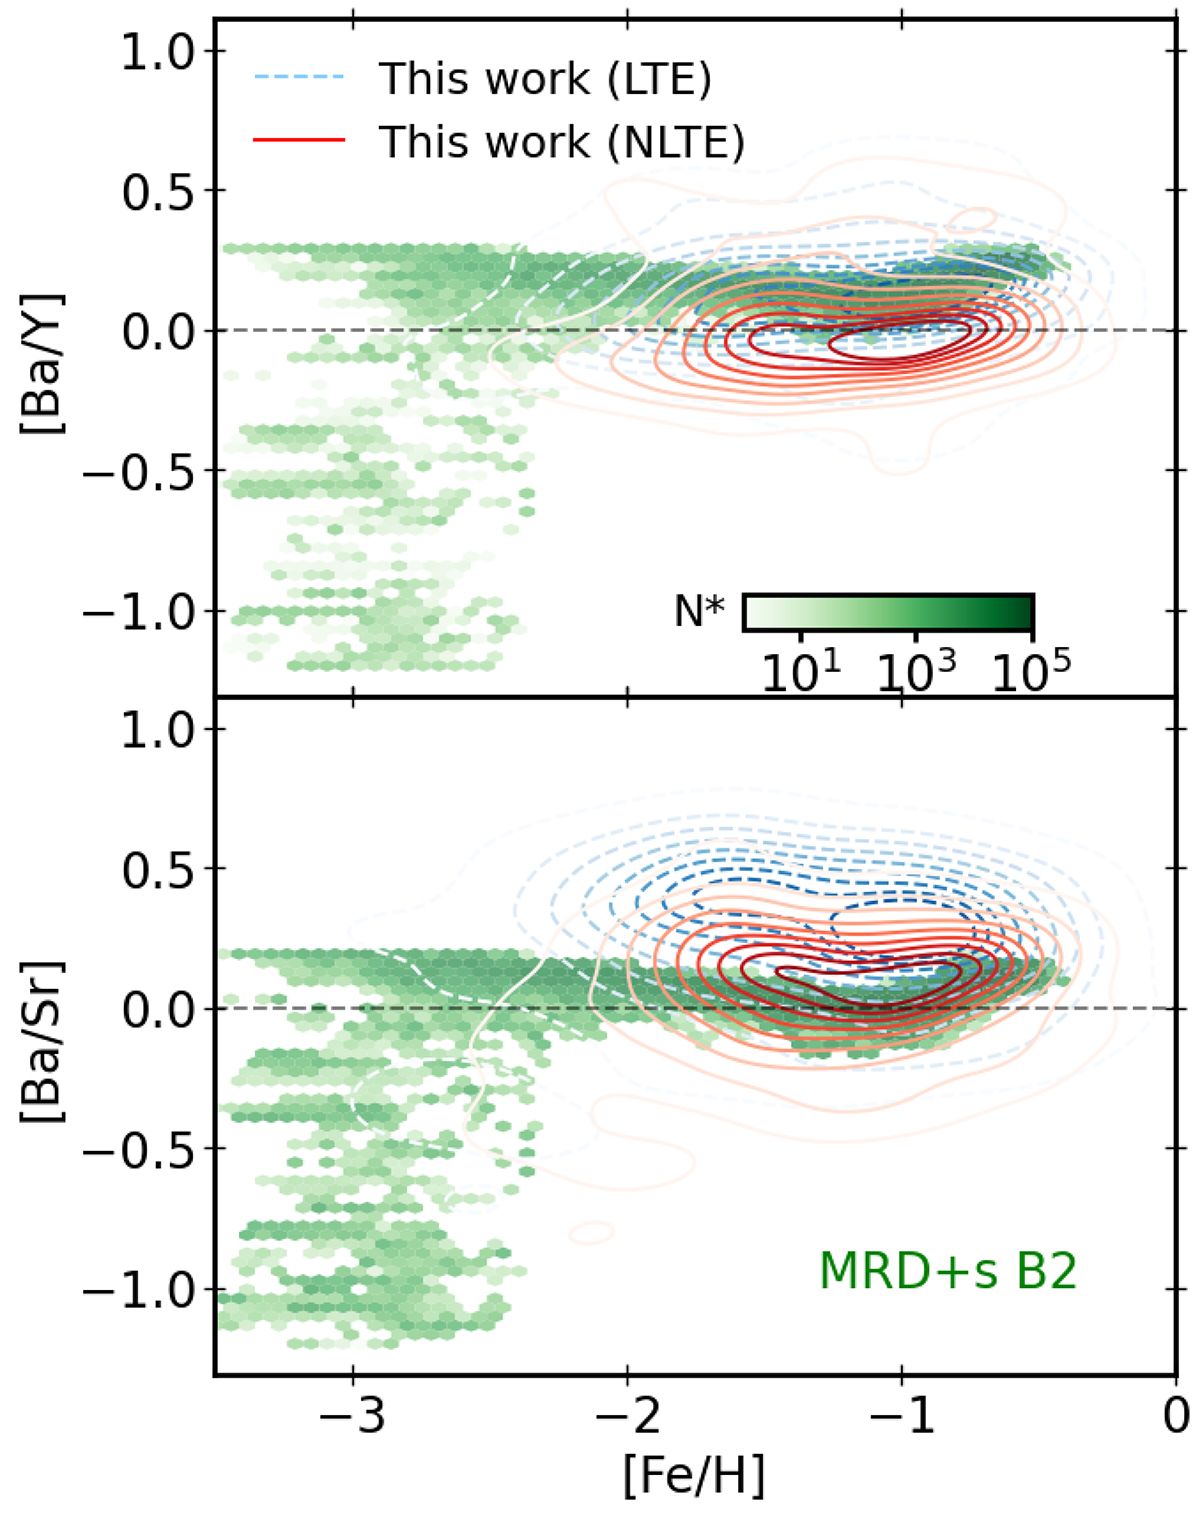
Download original image
[Ba/Y] (top) and [Ba/Sr] ratios as a function of [Fe/H]. Blue and red contours show LTE and NLTE abundances, respectively, for 187 stars. We also show stochastic chemical evolution models (MRD+s B2) from Cescutti & Chiappini (2014).
Current usage metrics show cumulative count of Article Views (full-text article views including HTML views, PDF and ePub downloads, according to the available data) and Abstracts Views on Vision4Press platform.
Data correspond to usage on the plateform after 2015. The current usage metrics is available 48-96 hours after online publication and is updated daily on week days.
Initial download of the metrics may take a while.