Fig. 6.
Download original image
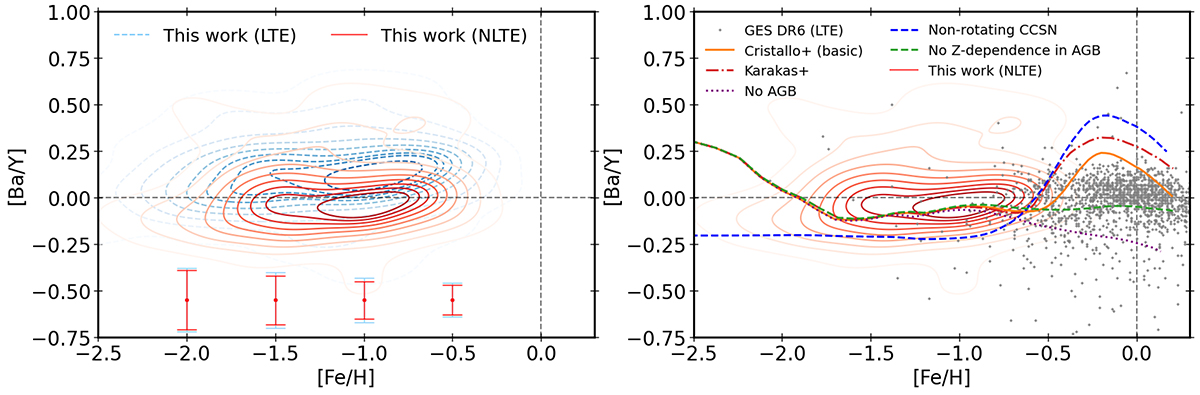
Chemical abundance ratios [Ba/Y] in both LTE (blue contours) and NLTE (red contours) as a function of [Fe/H] (LTE and NLTE, respectively), for 187 stars (left). Error bars correspond to mean uncertainties in LTE and NLTE. Only NLTE [Ba/Y] (red contours) together with Gaia-ESO sample used by Lian et al. (2023), as well as one-zone chemical evolution models with different yields prescriptions (right).
Current usage metrics show cumulative count of Article Views (full-text article views including HTML views, PDF and ePub downloads, according to the available data) and Abstracts Views on Vision4Press platform.
Data correspond to usage on the plateform after 2015. The current usage metrics is available 48-96 hours after online publication and is updated daily on week days.
Initial download of the metrics may take a while.