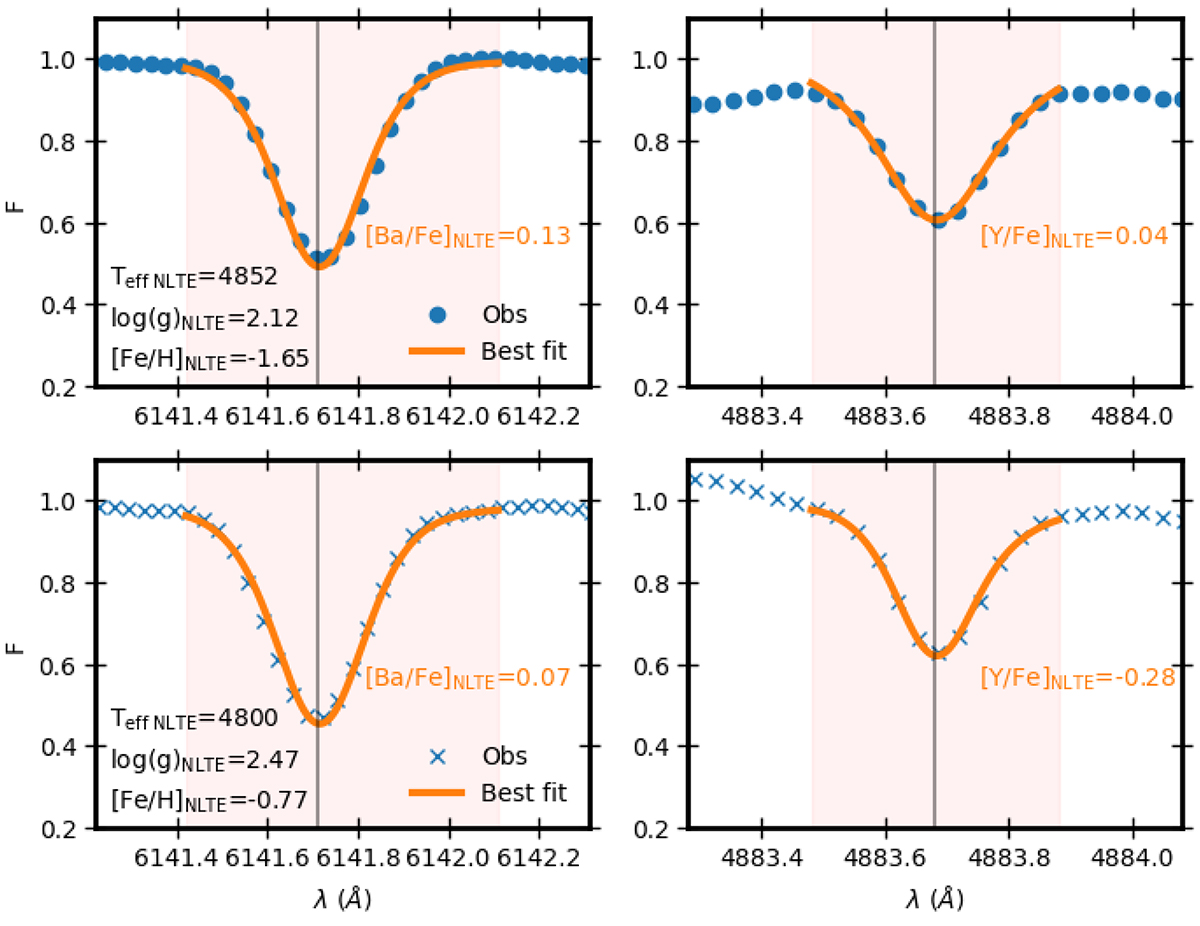
Fig. 2.
Download original image
Examples of Ba II (left) and Y II (right) lines in the spectra of two red giants with [Fe/H]NLTE = −1.65 (top) and [Fe/H]NLTE = −0.77 (bottom). The red shaded area represents the spectral range over which the line is fitted. The orange curve corresponds to the best line-fit. The black vertical corresponds to the central wavelength of the line.
Current usage metrics show cumulative count of Article Views (full-text article views including HTML views, PDF and ePub downloads, according to the available data) and Abstracts Views on Vision4Press platform.
Data correspond to usage on the plateform after 2015. The current usage metrics is available 48-96 hours after online publication and is updated daily on week days.
Initial download of the metrics may take a while.