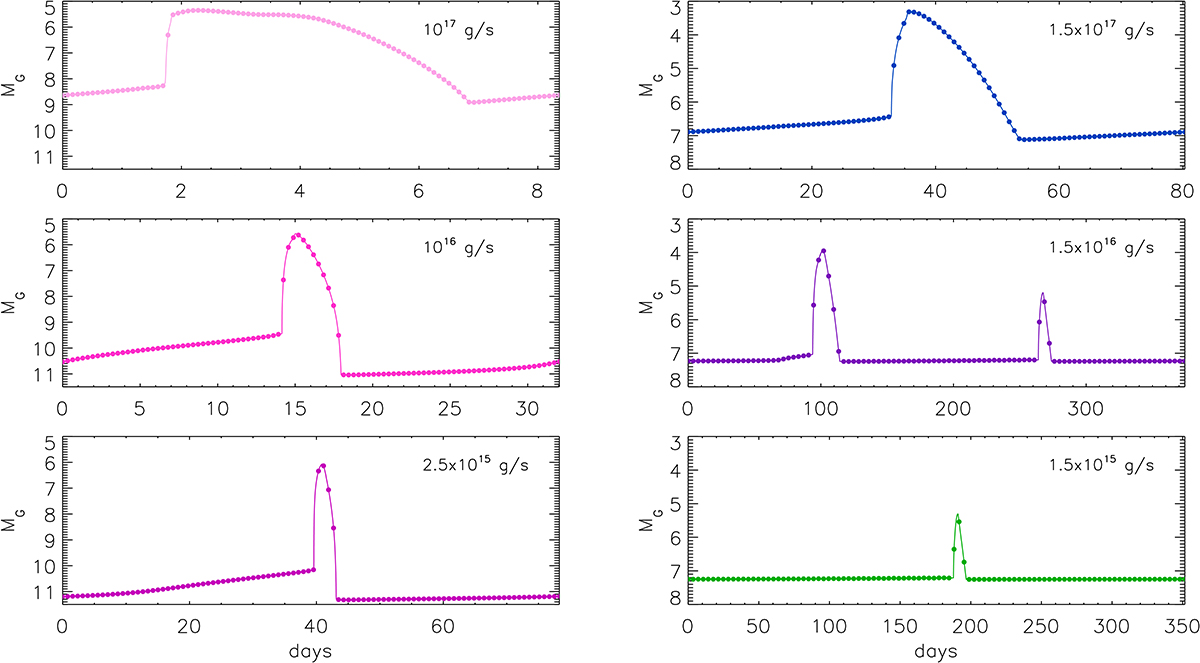
Fig. B.1.
Download original image
Light curves for the dwarf novae colour–magnitude tracks plotted in Fig. 7. The recurrence timescale of the outburst cycle sets the time span of each panel. Left panels: Light curves for the system with Porb = 88 min. Right panels: Light curves for the system with Porb = 6 hr. The dots regularly sample in time the outburst cycle.
Current usage metrics show cumulative count of Article Views (full-text article views including HTML views, PDF and ePub downloads, according to the available data) and Abstracts Views on Vision4Press platform.
Data correspond to usage on the plateform after 2015. The current usage metrics is available 48-96 hours after online publication and is updated daily on week days.
Initial download of the metrics may take a while.