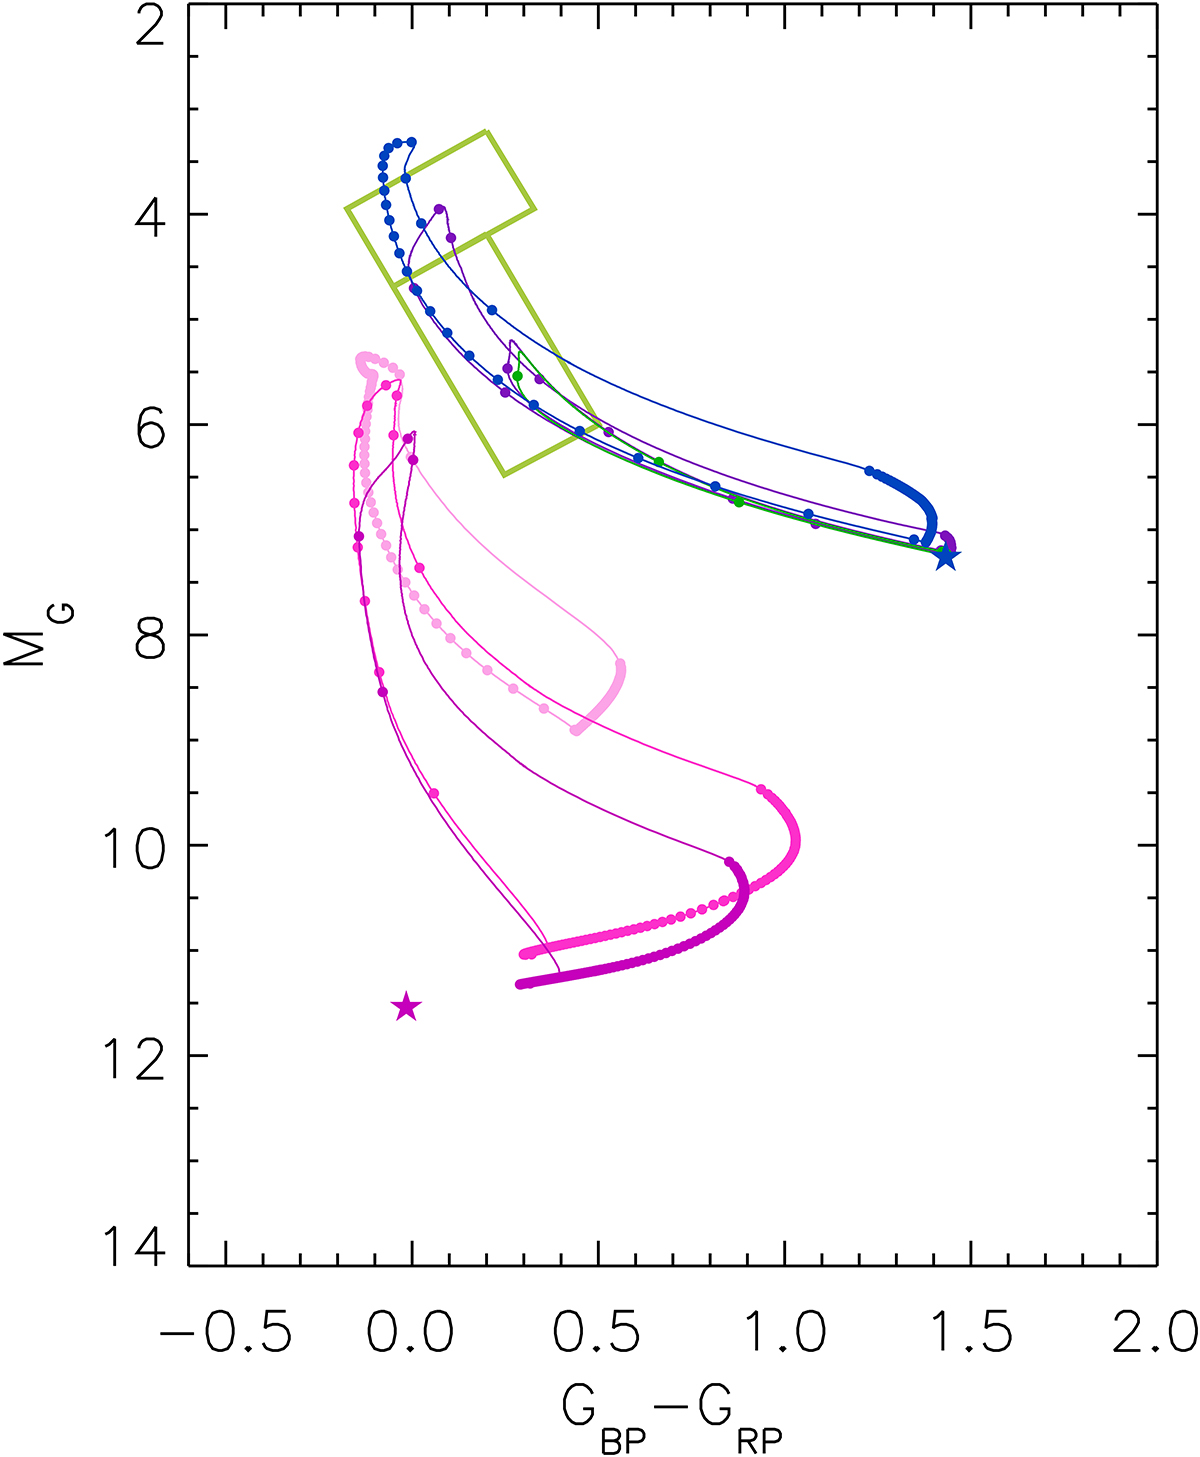
Fig. 7.
Download original image
Colour–magnitude tracks traced in the HDR by representative CVs with unstable accretion discs. Two sets of tracks are plotted, corresponding to Porb = 88 min (bottom set, pinkish colours) and Porb = 6 h (top set, bluish colours). Three tracks are plotted in each set, corresponding to three different mass transfer rates Ṁt. The dots on each track regularly sample the outburst cycle over time. The light curves are shown in Fig. B.1. The green rectangles delimit the upper and lower hook regions defined in Fig. 2.
Current usage metrics show cumulative count of Article Views (full-text article views including HTML views, PDF and ePub downloads, according to the available data) and Abstracts Views on Vision4Press platform.
Data correspond to usage on the plateform after 2015. The current usage metrics is available 48-96 hours after online publication and is updated daily on week days.
Initial download of the metrics may take a while.