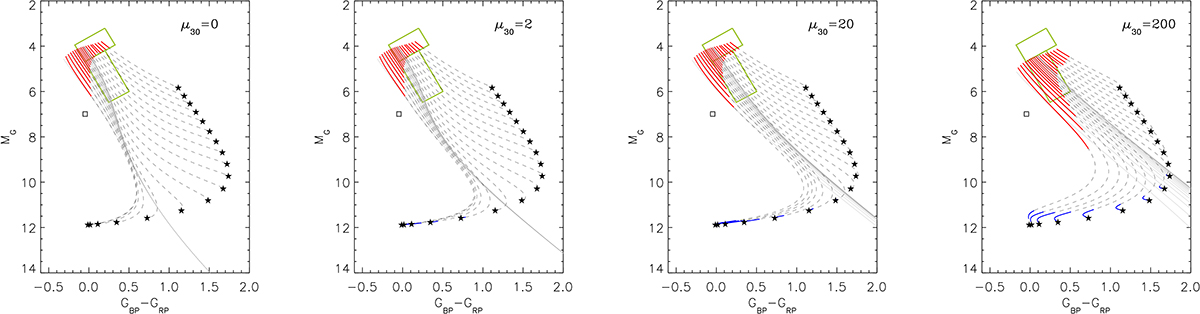
Fig. 6.
Download original image
Sequences of colour–magnitude positions assuming a steady accretion disc and, for each panel, a given value of the white dwarf dipole moment (μ30 = μ/1030 G cm3). Each sequence is obtained by varying Ṁ up to 1018 g s−1 for a given Porb. The orbital period increases from the bottom left sequence (Porb = 80 min) to the top right sequence (Porb = 7 h). The thin grey lines trace only the contribution of the disc. The dashed lines add light from the companion star, the white dwarf, and the bright spot. The stars indicate the location of the combined light from the companion and white dwarf for each Porb sequence. The square indicates the position of the most luminous bright spot emission. When μ30 ≠ 0, the inner disc is truncated at the magnetospheric radius Rm. The thick red and blue lines overplotted on the dashed lines highlight the location of hot and cold stable steady discs, respectively. The green rectangles delimit the upper and lower hook regions defined in Fig. 2.
Current usage metrics show cumulative count of Article Views (full-text article views including HTML views, PDF and ePub downloads, according to the available data) and Abstracts Views on Vision4Press platform.
Data correspond to usage on the plateform after 2015. The current usage metrics is available 48-96 hours after online publication and is updated daily on week days.
Initial download of the metrics may take a while.