Open Access
Fig. 4.
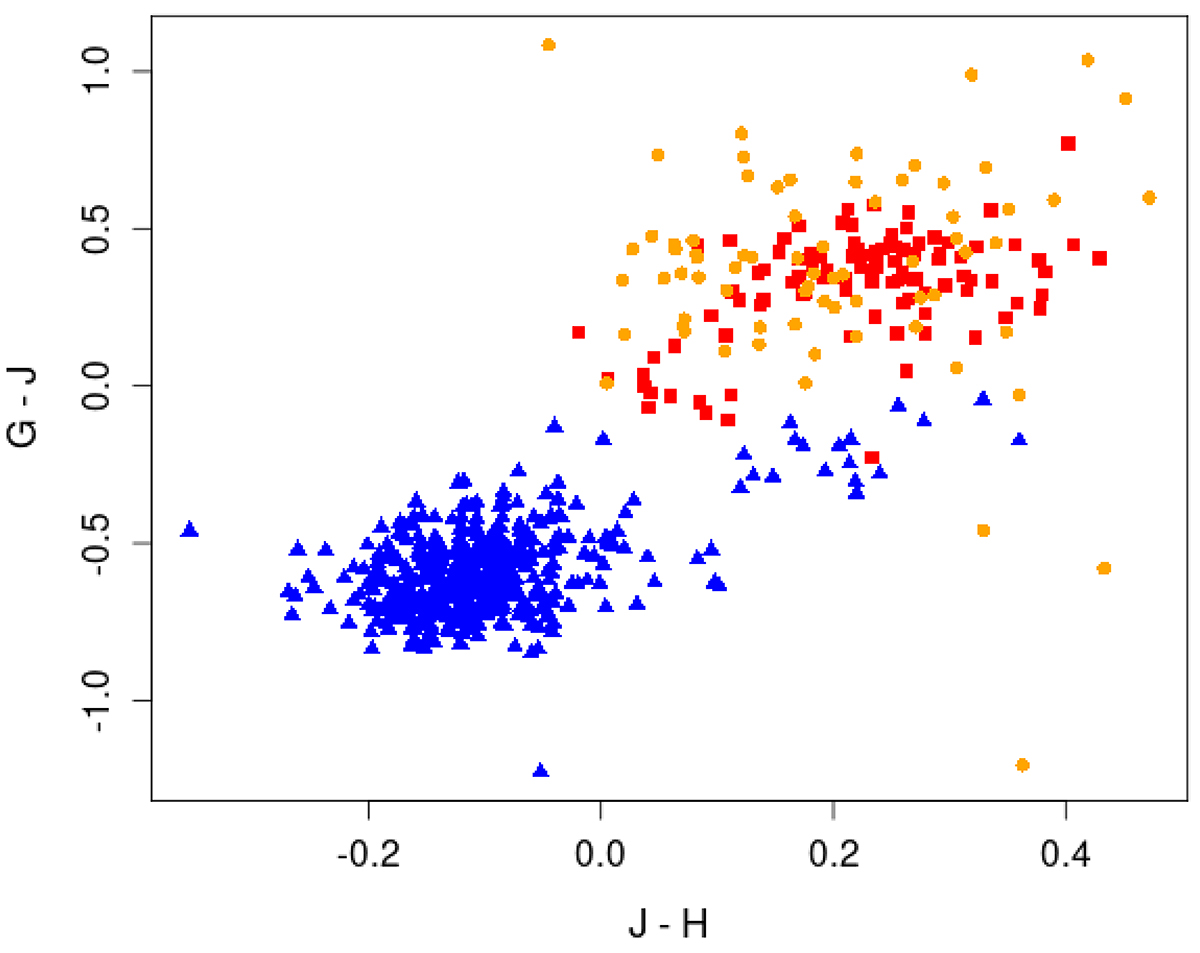
Download original image
Colour–colour diagram of stars in the areas indicated in Fig. 2, selected with A0 < 0.1, parallax uncertainty smaller than 10%, ruwe < 1.4, C* < 10 × σC*, and a 2MASS Qflag “AAA”. Blue triangles, red squares, and orange circles correspond to stars in the SDB area, the upper-hook area, and the low-hook area, respectively.
Current usage metrics show cumulative count of Article Views (full-text article views including HTML views, PDF and ePub downloads, according to the available data) and Abstracts Views on Vision4Press platform.
Data correspond to usage on the plateform after 2015. The current usage metrics is available 48-96 hours after online publication and is updated daily on week days.
Initial download of the metrics may take a while.