Open Access
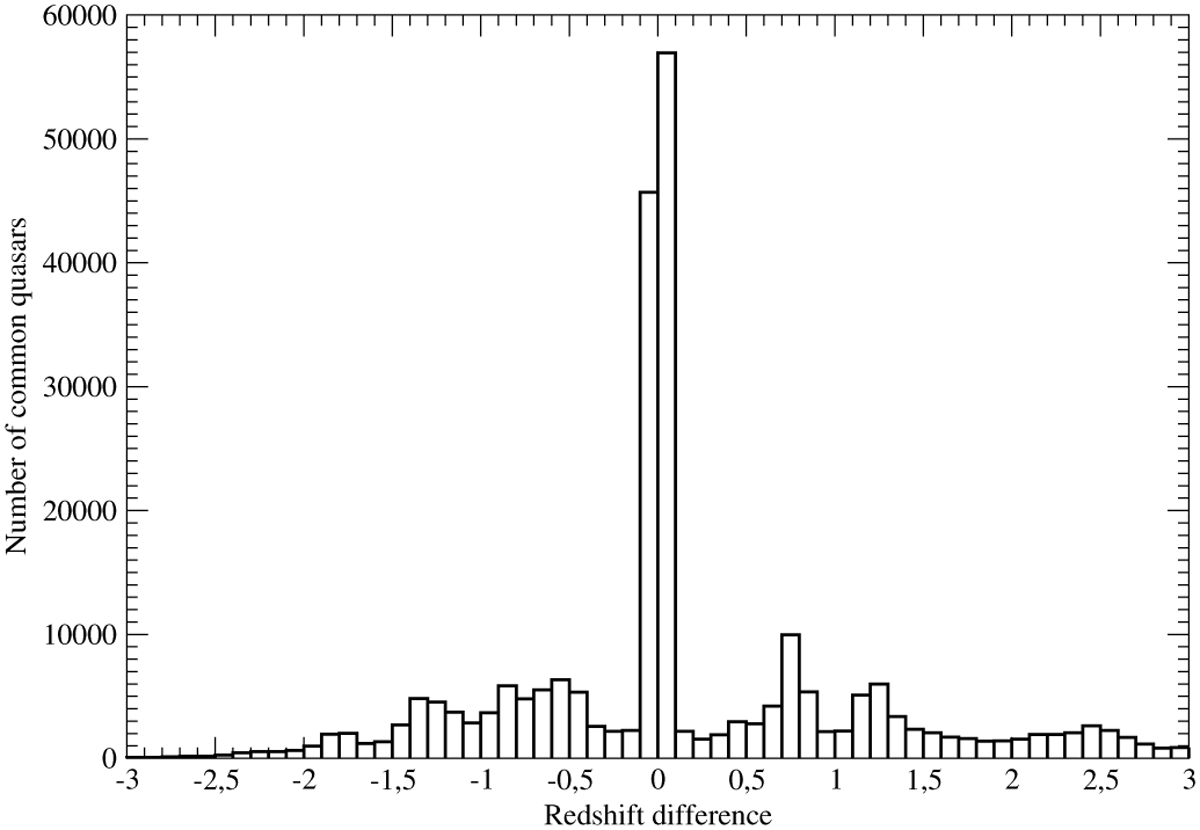
Fig. 2
Download original image
Histogram of the difference between the redshift value z given by a ground-based survey of the LQAC-6 and the redshift value given by Gaia DR3 concerning the 267 811 outliers verifying: z < zmin or z > zmax, where zmin and zmax are respectively the minimum and maximum values given by Gaia DR3.
Current usage metrics show cumulative count of Article Views (full-text article views including HTML views, PDF and ePub downloads, according to the available data) and Abstracts Views on Vision4Press platform.
Data correspond to usage on the plateform after 2015. The current usage metrics is available 48-96 hours after online publication and is updated daily on week days.
Initial download of the metrics may take a while.