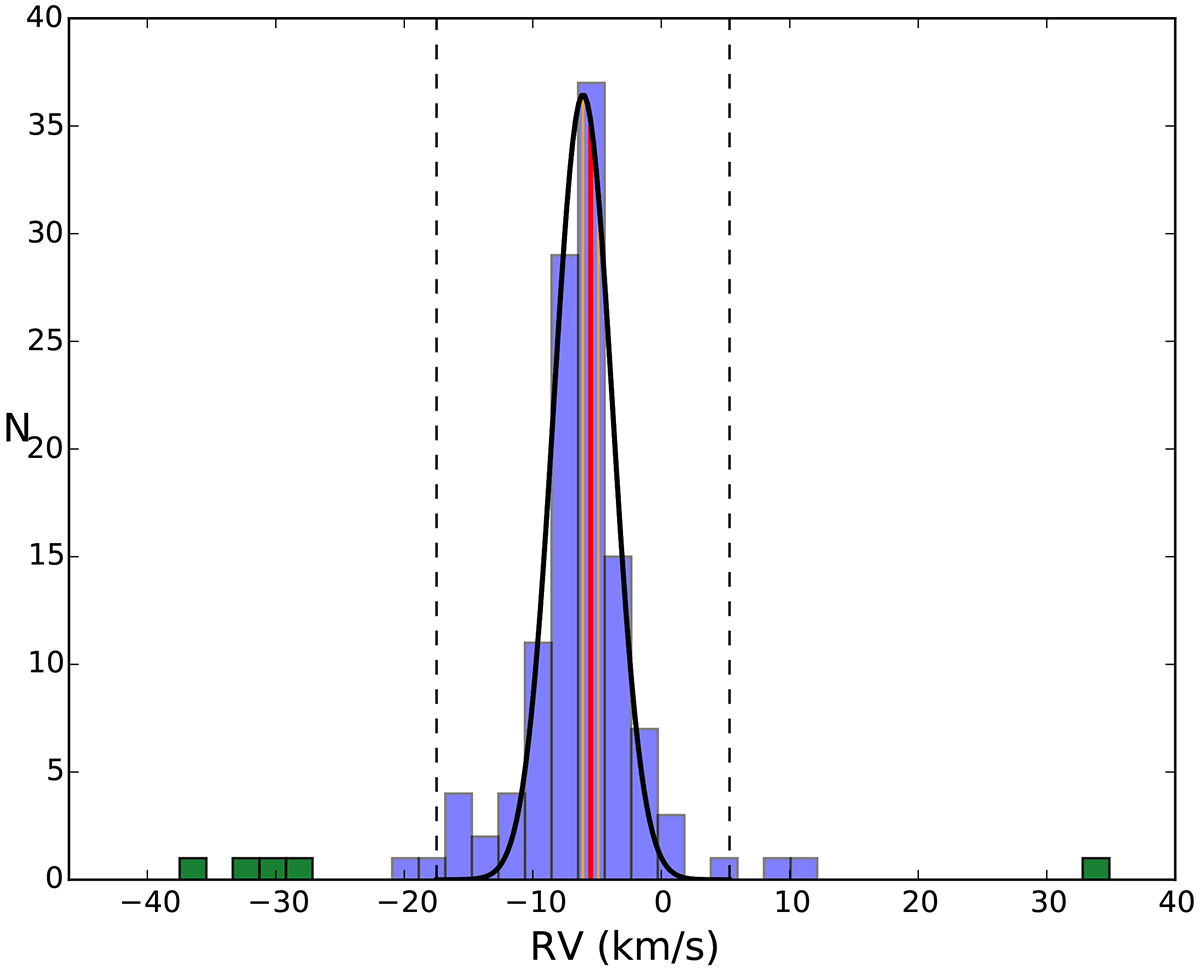
Fig. A.4.
Download original image
Distribution of the Gaia RV for the likely candidate members selected on the basis of the astrometric and photometric criteria explained in the text (blue histogram). The average RV for the cluster, found by the Gaussian fitting (solid black line), peaks at −6.1±2.3 km s−1. This value agrees closely with the RV obtained from the stars observed spectroscopically in this work (red line for the average value and orange lines for its uncertainty). The 5σ boundary is marked by dashed lines. The five objects that lie outside this boundary, taking into account their errors, have been represented with a green histogram and are considered non-members.
Current usage metrics show cumulative count of Article Views (full-text article views including HTML views, PDF and ePub downloads, according to the available data) and Abstracts Views on Vision4Press platform.
Data correspond to usage on the plateform after 2015. The current usage metrics is available 48-96 hours after online publication and is updated daily on week days.
Initial download of the metrics may take a while.