Fig. 9.
Download original image
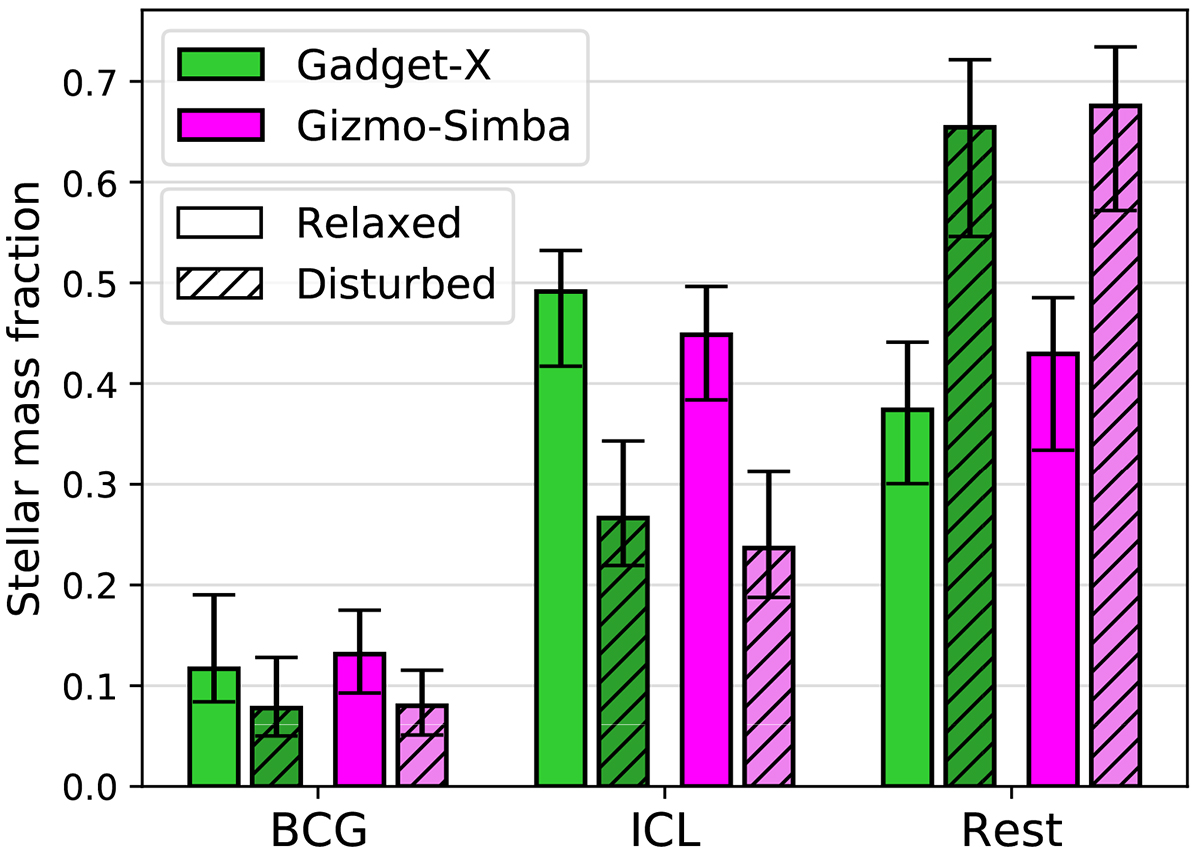
Stellar mass fraction for the BCG, ICL and rest of stars. The bar shows the median value for the 324 clusters, while the error bars indicate 16th–84th percentiles. The fraction is computed dividing the stellar mass content in each of the components by the total stellar mass inside R500, M*, 500. The straight and dashed bars separate into relaxed and disturbed clusters based on their χDS value at R500. “Relaxed” clusters are the 50 clusters with the highest χDS, while “disturbed” are the 50 clusters with the lowest value of χDS. As before, green bars are for GADGET-X, while magenta ones are for GIZMO-SIMBA results.
Current usage metrics show cumulative count of Article Views (full-text article views including HTML views, PDF and ePub downloads, according to the available data) and Abstracts Views on Vision4Press platform.
Data correspond to usage on the plateform after 2015. The current usage metrics is available 48-96 hours after online publication and is updated daily on week days.
Initial download of the metrics may take a while.