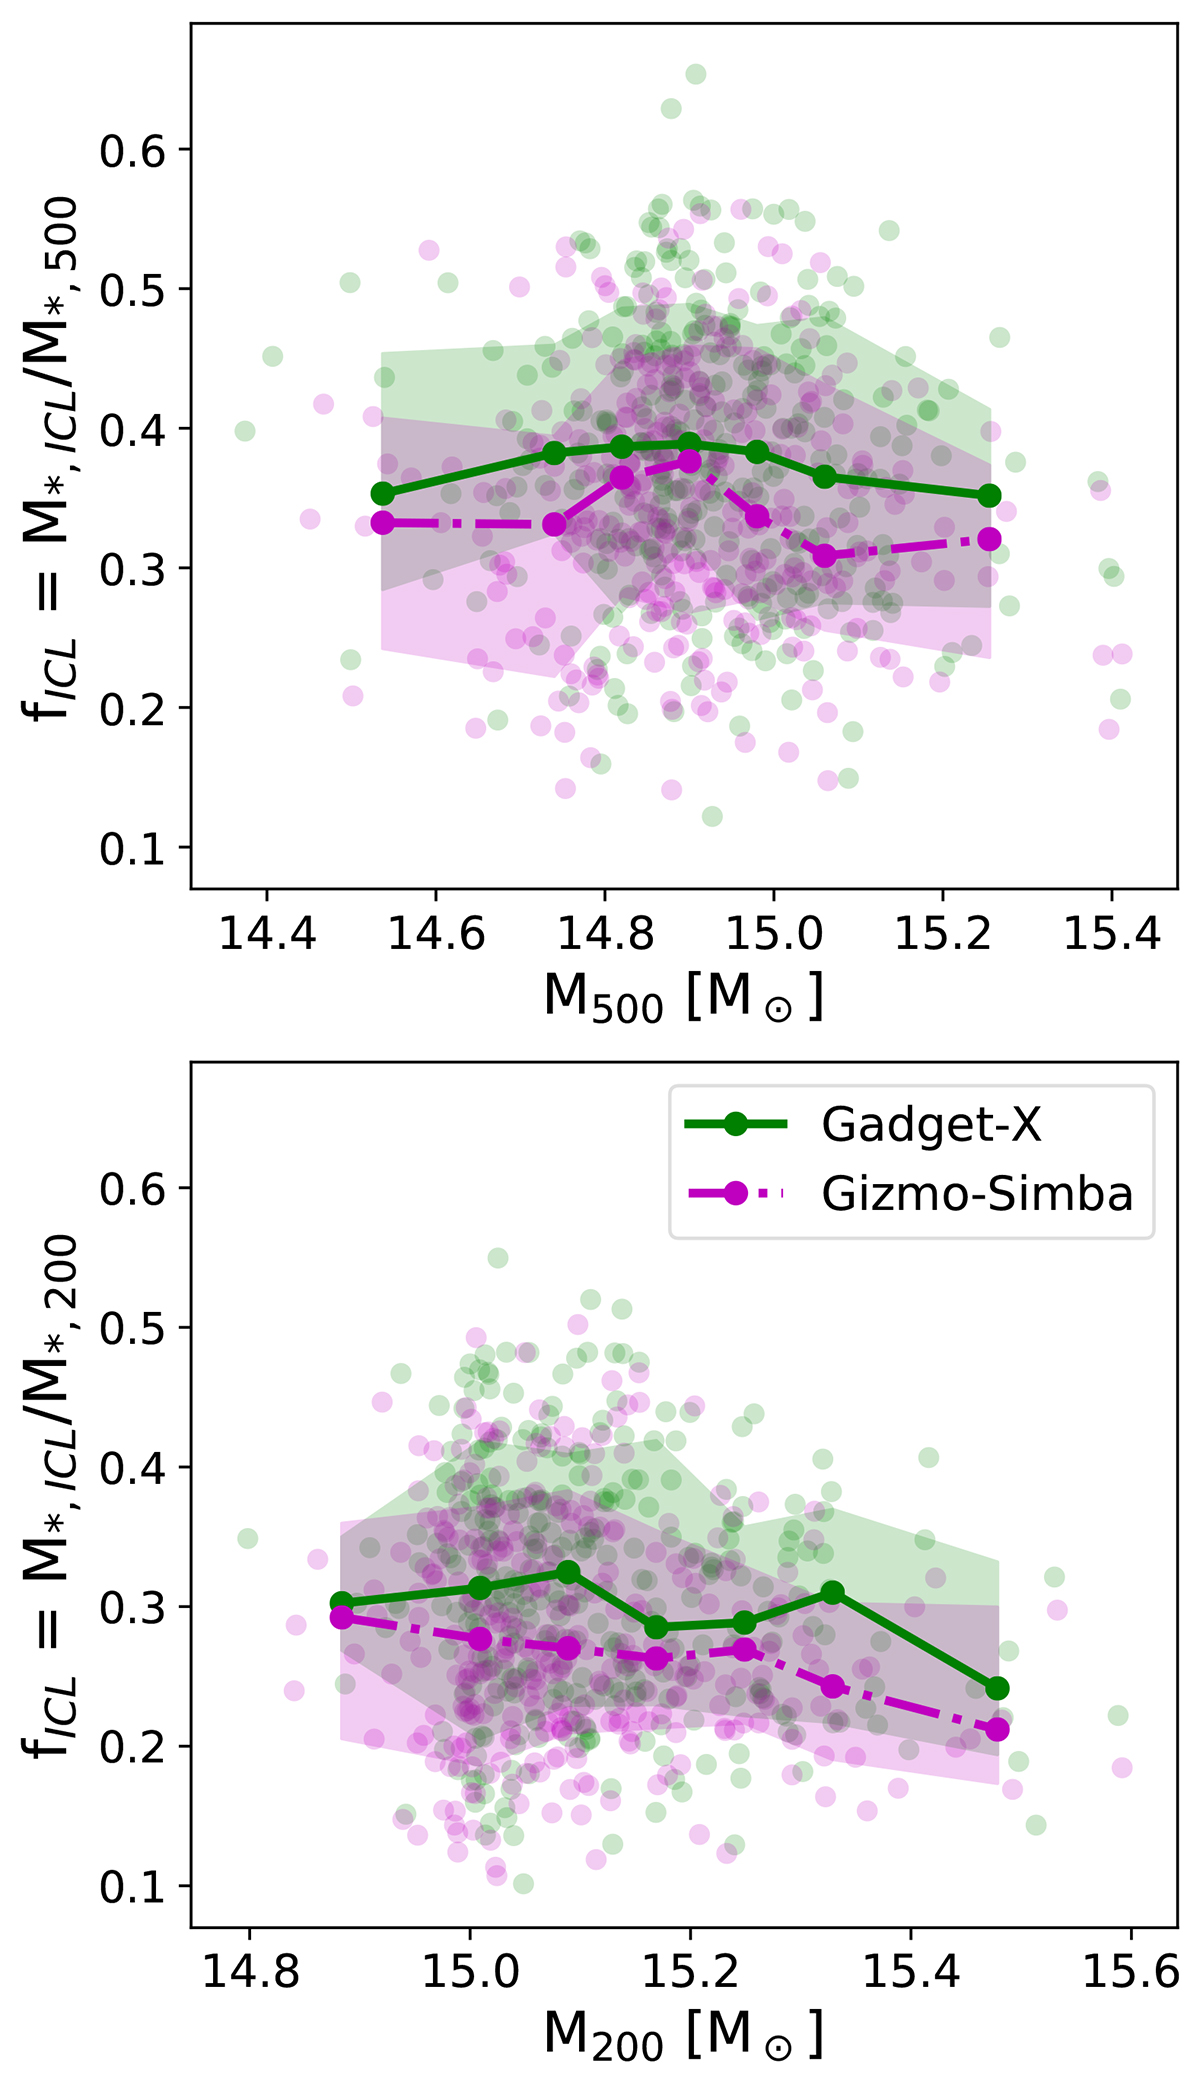
Fig. 5.
Download original image
ICL mass fraction as a function of cluster mass, considering overdensities of 500 (top) and 200 (bottom). The lines show the median values and the shaded regions the 16th–84th percentiles. Results are shown for both GADGET-X (green solid line) and GIZMO-SIMBA (magenta dash-dotted line). Note that the scale is the same for both plots in the Y-axis, but different for the X-axis.
Current usage metrics show cumulative count of Article Views (full-text article views including HTML views, PDF and ePub downloads, according to the available data) and Abstracts Views on Vision4Press platform.
Data correspond to usage on the plateform after 2015. The current usage metrics is available 48-96 hours after online publication and is updated daily on week days.
Initial download of the metrics may take a while.