Fig. 11.
Download original image
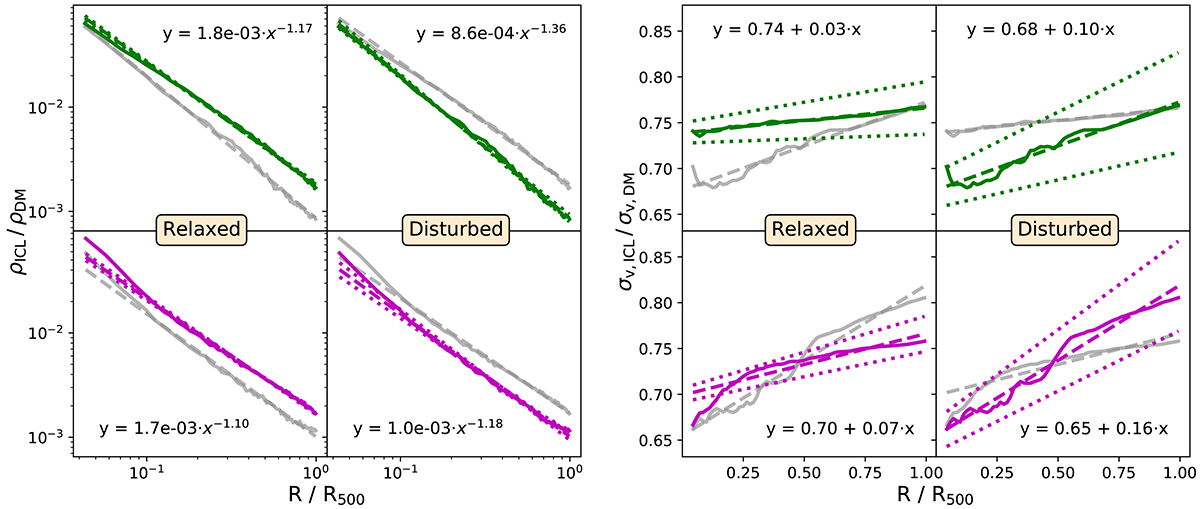
For the density (left) and velocity dispersion (right) profiles, ratio between ICL and DM components. Same as Fig. 10 but for the subsamples of the 50 most relaxed and disturbed clusters (see Sect. 5.3). Green is for GADGET-X and magenta for GIZMO-SIMBA simulations. In each panel, the grey line corresponds to the opposite subsample for the same simulation, namely relaxed or disturbed, to allow for an easier comparison between relaxed and disturbed clusters.
Current usage metrics show cumulative count of Article Views (full-text article views including HTML views, PDF and ePub downloads, according to the available data) and Abstracts Views on Vision4Press platform.
Data correspond to usage on the plateform after 2015. The current usage metrics is available 48-96 hours after online publication and is updated daily on week days.
Initial download of the metrics may take a while.