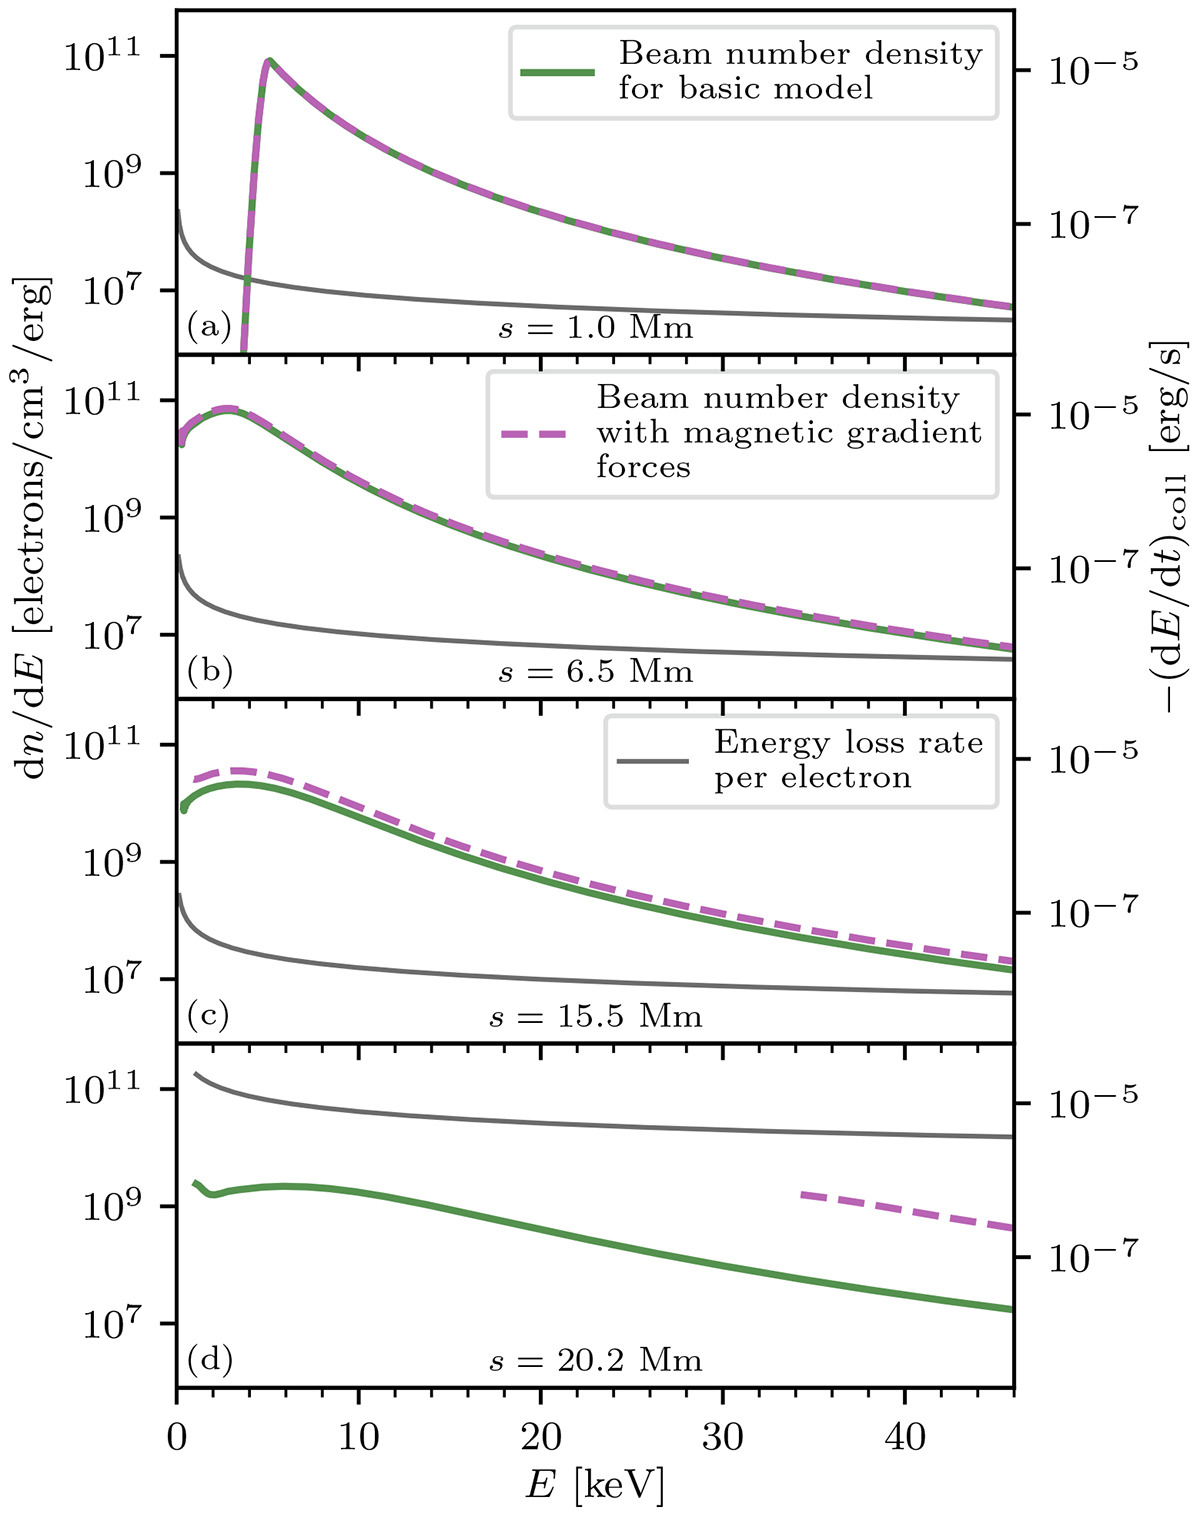
Fig. 5.
Download original image
Distribution dn/dE of beam electrons over energy E at the four separate distances s (with a separate panel for each distance) indicated in Fig. 4, both for a simulation that ignores (solid green curve) and includes (dashed purple curve) magnetic gradient forces. Also included is the collisional rate of energy loss for a single electron, −(dE/dt)coll, from Eq. (48) (solid grey curve). Summing a distribution curve and energy loss rate curve would yield a log-space curve of the integrand for the deposited power density Qbeam (Eq. (47)).
Current usage metrics show cumulative count of Article Views (full-text article views including HTML views, PDF and ePub downloads, according to the available data) and Abstracts Views on Vision4Press platform.
Data correspond to usage on the plateform after 2015. The current usage metrics is available 48-96 hours after online publication and is updated daily on week days.
Initial download of the metrics may take a while.