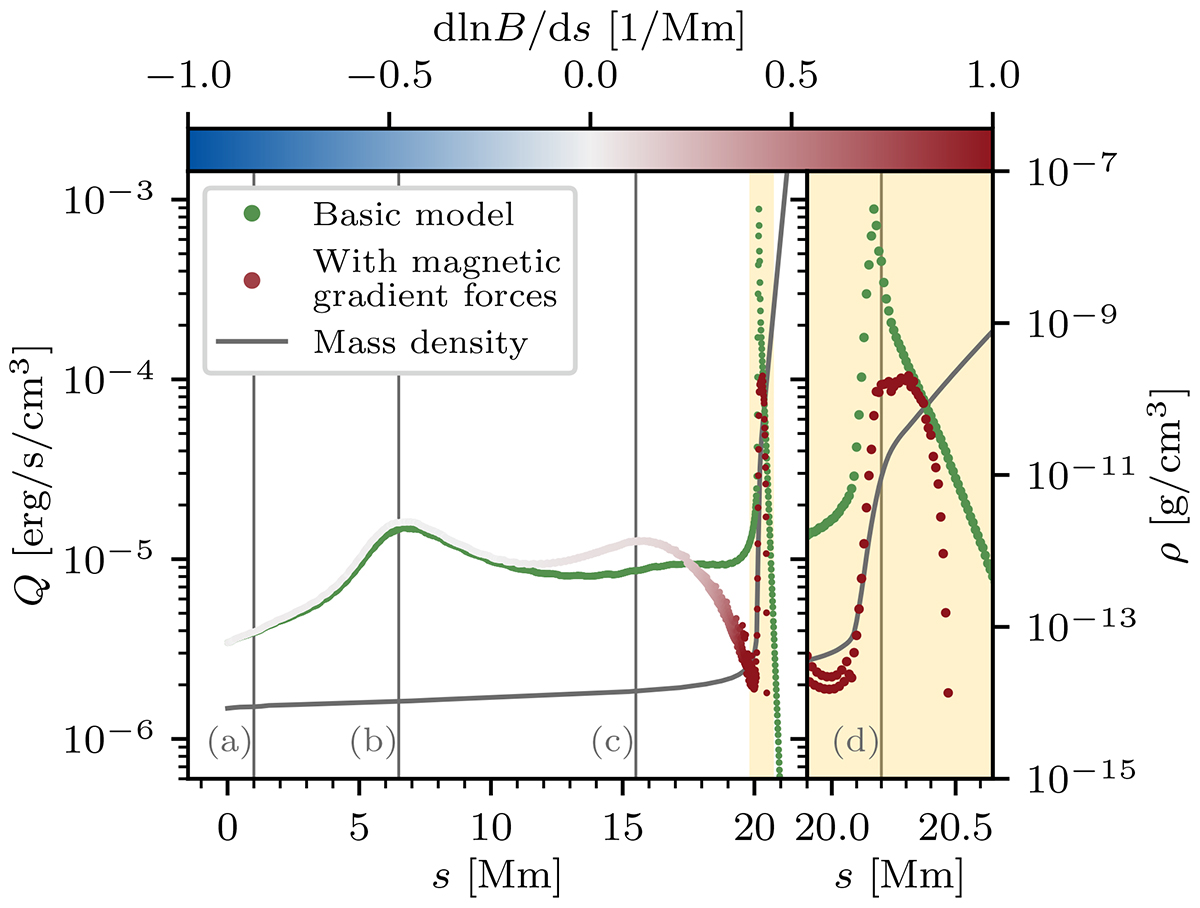
Fig. 4.
Download original image
Deposited power density Q as a function of propagation distance for a representative beam in set 1 in Fig. 3 for two separate simulations, one with magnetic gradient forces (points with colour varying between blue and red) and one without (green points). The colours for the former simulation indicate the local relative change in magnetic flux density B with distance s. Blue colours imply that the magnetic field decreases in strength in the direction of propagation, while red colours imply that the magnetic field increases in strength. The local plasma mass density is shown as a solid grey curve. The right panel with a yellow background gives a magnified view of the plot in the left panel around the lower atmosphere, over the distance range indicated by the yellow band in the left panel. The labelled vertical lines mark locations of interest along the trajectory: (a) is near the site of injection, (b) is at the first coronal peak in Q, (c) is at the second coronal peak present only in the simulation with magnetic gradient forces, and (d) is near the peaks in Q below the transition region. The beam has ℱbeam, 0 ≈ 1.4 × 10⁴ erg s−1 cm−2 and Ec ≈ 5 keV.
Current usage metrics show cumulative count of Article Views (full-text article views including HTML views, PDF and ePub downloads, according to the available data) and Abstracts Views on Vision4Press platform.
Data correspond to usage on the plateform after 2015. The current usage metrics is available 48-96 hours after online publication and is updated daily on week days.
Initial download of the metrics may take a while.