Open Access
Fig. 1.
Download original image
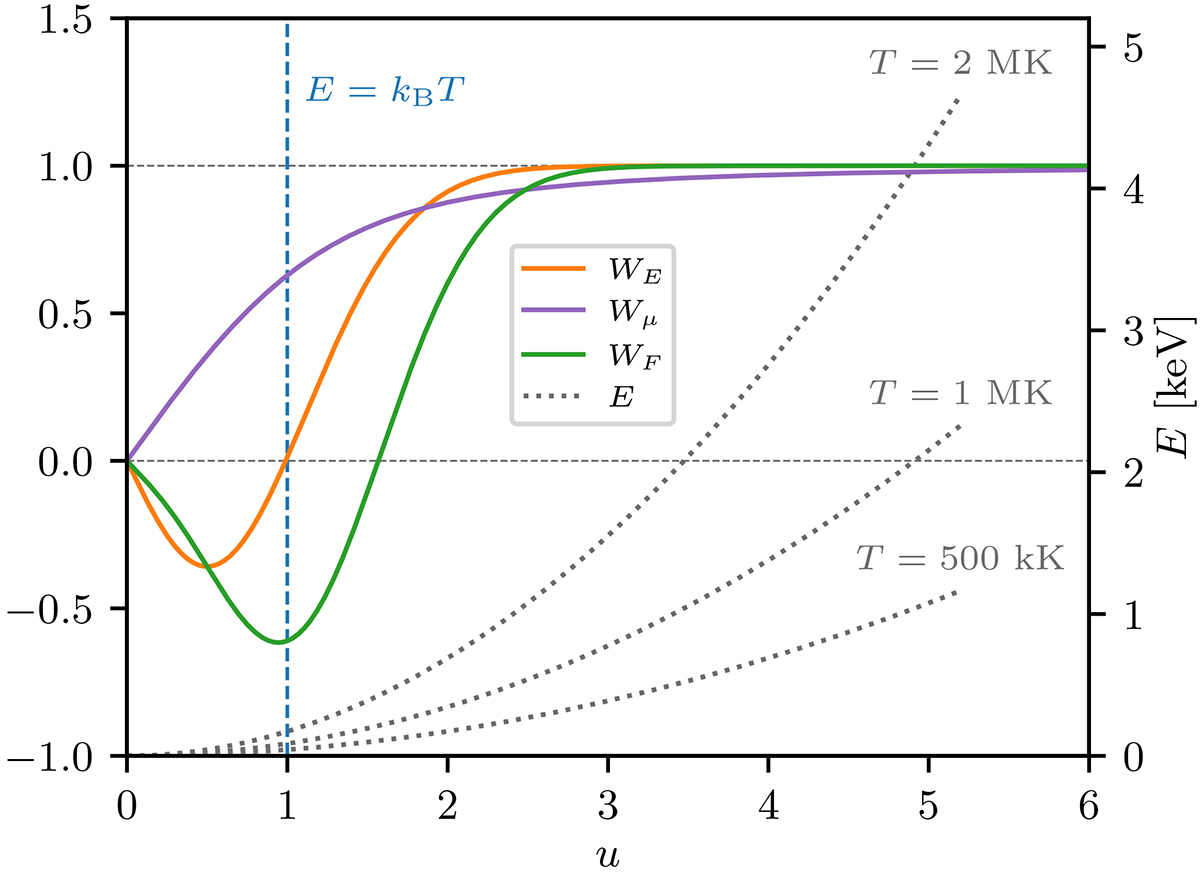
Plots of the warm-target contribution functions WE (orange), Wμ (purple), and WF (green) as functions of the normalised speed ![]() . The dotted grey curves show the mapping between u and energy E for different temperatures T. The dashed blue line highlights the location of u = 1, corresponding to E = kBT.
. The dotted grey curves show the mapping between u and energy E for different temperatures T. The dashed blue line highlights the location of u = 1, corresponding to E = kBT.
Current usage metrics show cumulative count of Article Views (full-text article views including HTML views, PDF and ePub downloads, according to the available data) and Abstracts Views on Vision4Press platform.
Data correspond to usage on the plateform after 2015. The current usage metrics is available 48-96 hours after online publication and is updated daily on week days.
Initial download of the metrics may take a while.