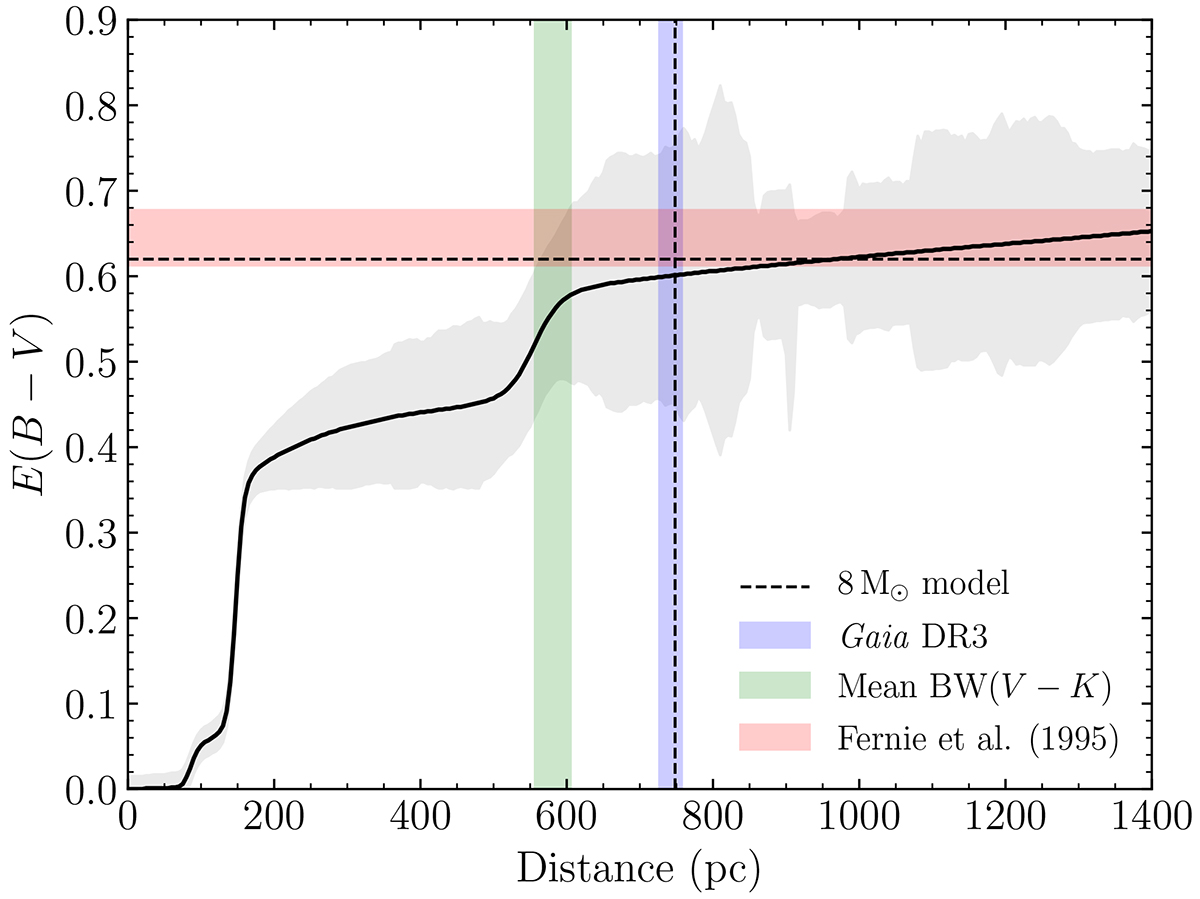
Fig. 7.
Download original image
Color excess E(B − V) in the direction of Y Oph versus the distance, from 3D extinction map (Lallement et al. 2014; Capitanio et al. 2017). The horizontal red strip indicates mean E(B − V) and standard deviation of the mean as compiled by Fernie et al. (1995a). Green and blue strips indicate the mean BW(V − K) distance and dGaia distance Gaia DR3 (Gaia Collaboration 2022), respectively.
Current usage metrics show cumulative count of Article Views (full-text article views including HTML views, PDF and ePub downloads, according to the available data) and Abstracts Views on Vision4Press platform.
Data correspond to usage on the plateform after 2015. The current usage metrics is available 48-96 hours after online publication and is updated daily on week days.
Initial download of the metrics may take a while.